When copper futures eyed a push above $5 per pound in May, it looked like we were starting to witness one of the breakout trades this decade. However, the hype quickly died down as price fell sharply towards the end of May and that led to another 5% drop in June. The slight rebound earlier this month has been dashed and copper is down almost 5% again in the last four days:
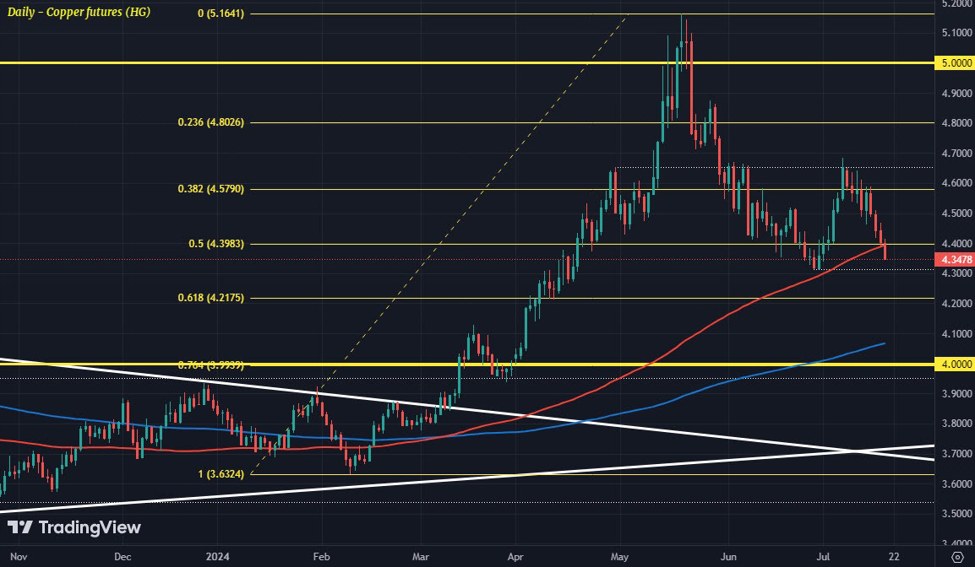
Copper futures (HG) daily chart ($/lbs)
A key thing to note in the fall this week is that price is breaking below the 100-day moving average (red line) for the first time since February. That’s a big blow to the buying momentum and frees up room for a steeper decline. Now, the June low at $4.31 will be eyed before going back to support from the Fib levels above.
Fundamentally, the factors driving copper prices higher this year hasn’t changed too much. The drive for the green transition and supply concerns were key reasons in providing a tailwind for copper.
But at the same time, copper tends to correlate with the health of the global economy. And the outlook for the latter has been struggling, especially with the major slowdown in China since last year. For some context, China buys roughly 40%-50% of the newly mined copper each year. So, that’s a major demand source.
From a structural perspective, I believe that copper still has some bullish underlying factors going for it. But it might have to wait until after the summer for that to show up in the price. That as well as the technicals providing some supportive factor for buyers to step back in.
Looking at the seasonal pattern, August has been the worst month for copper over the last 20 years. So, that’s one reason to stay guarded for at least the next few weeks.
Copper futures (HG) monthly seasonal pattern (% change)