Fundamental
Overview
Crude oil sold off pretty
heavily in the latter part of last week as we got some very weak US data
releases first with the ISM Manufacturing PMI and then with the NFP report. The
market eventually bounced back on Monday and extended the gains yesterday with
the appointment of the new Hamas leader being the likely catalyst as he’s seen
as more hard-line.
This follows the assassination
of the former Hamas leader Ismail Haniyeh in Iran with Israel being blamed for
the attack. The tension in the Middle East continues to be high as the world is
waiting for Iran’s retaliation and fears a wider escalation. This keeps the
supply side of the equation uncertain and raises the geopolitical risk premium.
Crude Oil
Technical Analysis – Daily Timeframe
Crude Oil Daily
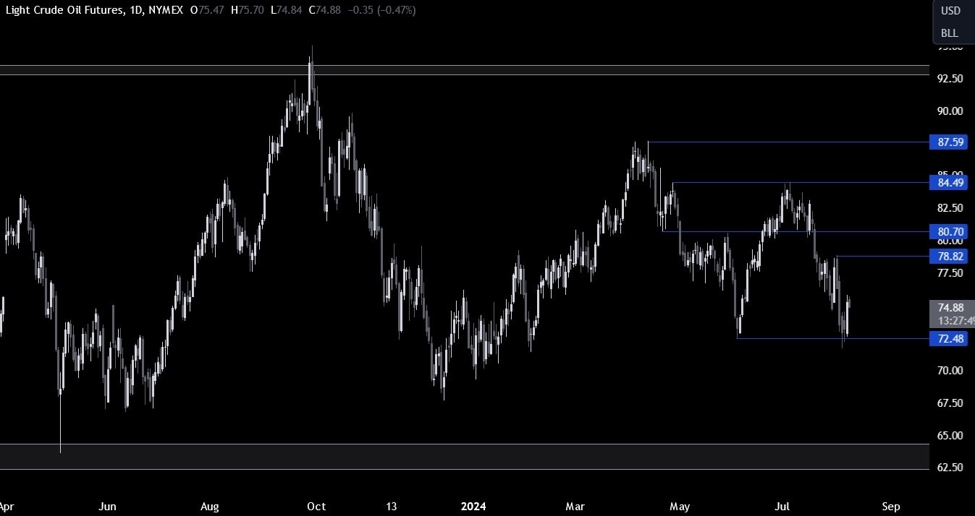
On the daily chart, we can
see that crude oil dropped all the way back to the 72.50 low where we got a
bounce on Monday and then a stronger rally on Wednesday. The sellers will want
to see the price breaking below the 72.50 level to increase the bearish bets
into the 65.00 price region.
The buyers, on the other
hand, will look for a rally back into the 80.00 level although we will need some
key breaks on the lower timeframes to get the momentum going.
Crude Oil Technical
Analysis – 4 hour Timeframe
Crude Oil 4 hour
On the 4 hour chart, we can
see that the price yesterday broke above a minor resistance
around the 74.50 level and extended the rally into the 76.00 handle. The price
is now pulling back to retest the level and that’s where we can expect the
buyers to step in with a defined risk below the level to position for a break
above the major trendline.
The sellers, on the other hand,
will want to see the price falling below the level to increase the bearish bets
into the 72.50 level targeting a break below it.
Crude Oil Technical
Analysis – 1 hour Timeframe
Crude Oil 1 hour
On the 1 hour chart, we can
see that we have also the 38.2% Fibonacci
retracement level adding confluence to the support zone around the 74.50
level. If the price rallies into the major trendline, we can expect the sellers
to lean on it to position for a drop back into the lows with a better risk to
reward setup. The red lines define the average daily range for today.
Upcoming
Catalysts
Today we get the latest US Jobless Claims figures which will likely be a
strong market moving release given the market’s focus on the labour market. The
market will also pay close attention to Fed members’ comments with Fed’s Barkin
scheduled to speak later in the day.