A Bitcoin cycle indicator from the analytics firm CryptoQuant suggests BTC has gone through a transition to a bearish phase after the crash.
CryptoQuant’s Bitcoin Bull-Bear Cycle Indicator Now In Negative Territory
In a new post on X, CryptoQuant Head of Research Julio Moreno has discussed the latest development in the “Bull-Bear Market Cycle Indicator” devised by the analytics firm.
This metric is based on CryptoQuant’s P&L Index, which itself is a unification of a few different popular on-chain indicators related to unrealized and realized profit/loss.
The P&L Index basically serves as a way to determine if BTC is in a bear or bull market right now. When the indicator crosses above its 365-day moving average (MA), BTC could be assumed to have entered into a bullish phase. Similarly, a drop under the MA implies a bearish transition.
The Bull-Bear Market Cycle Indicator, the actual metric of focus here, visualizes the P&L Index in a more convenient form by keeping track of its distance from its 365-day MA.
Now, here is a chart that shows the trend in this Bitcoin indicator over the last couple of years:
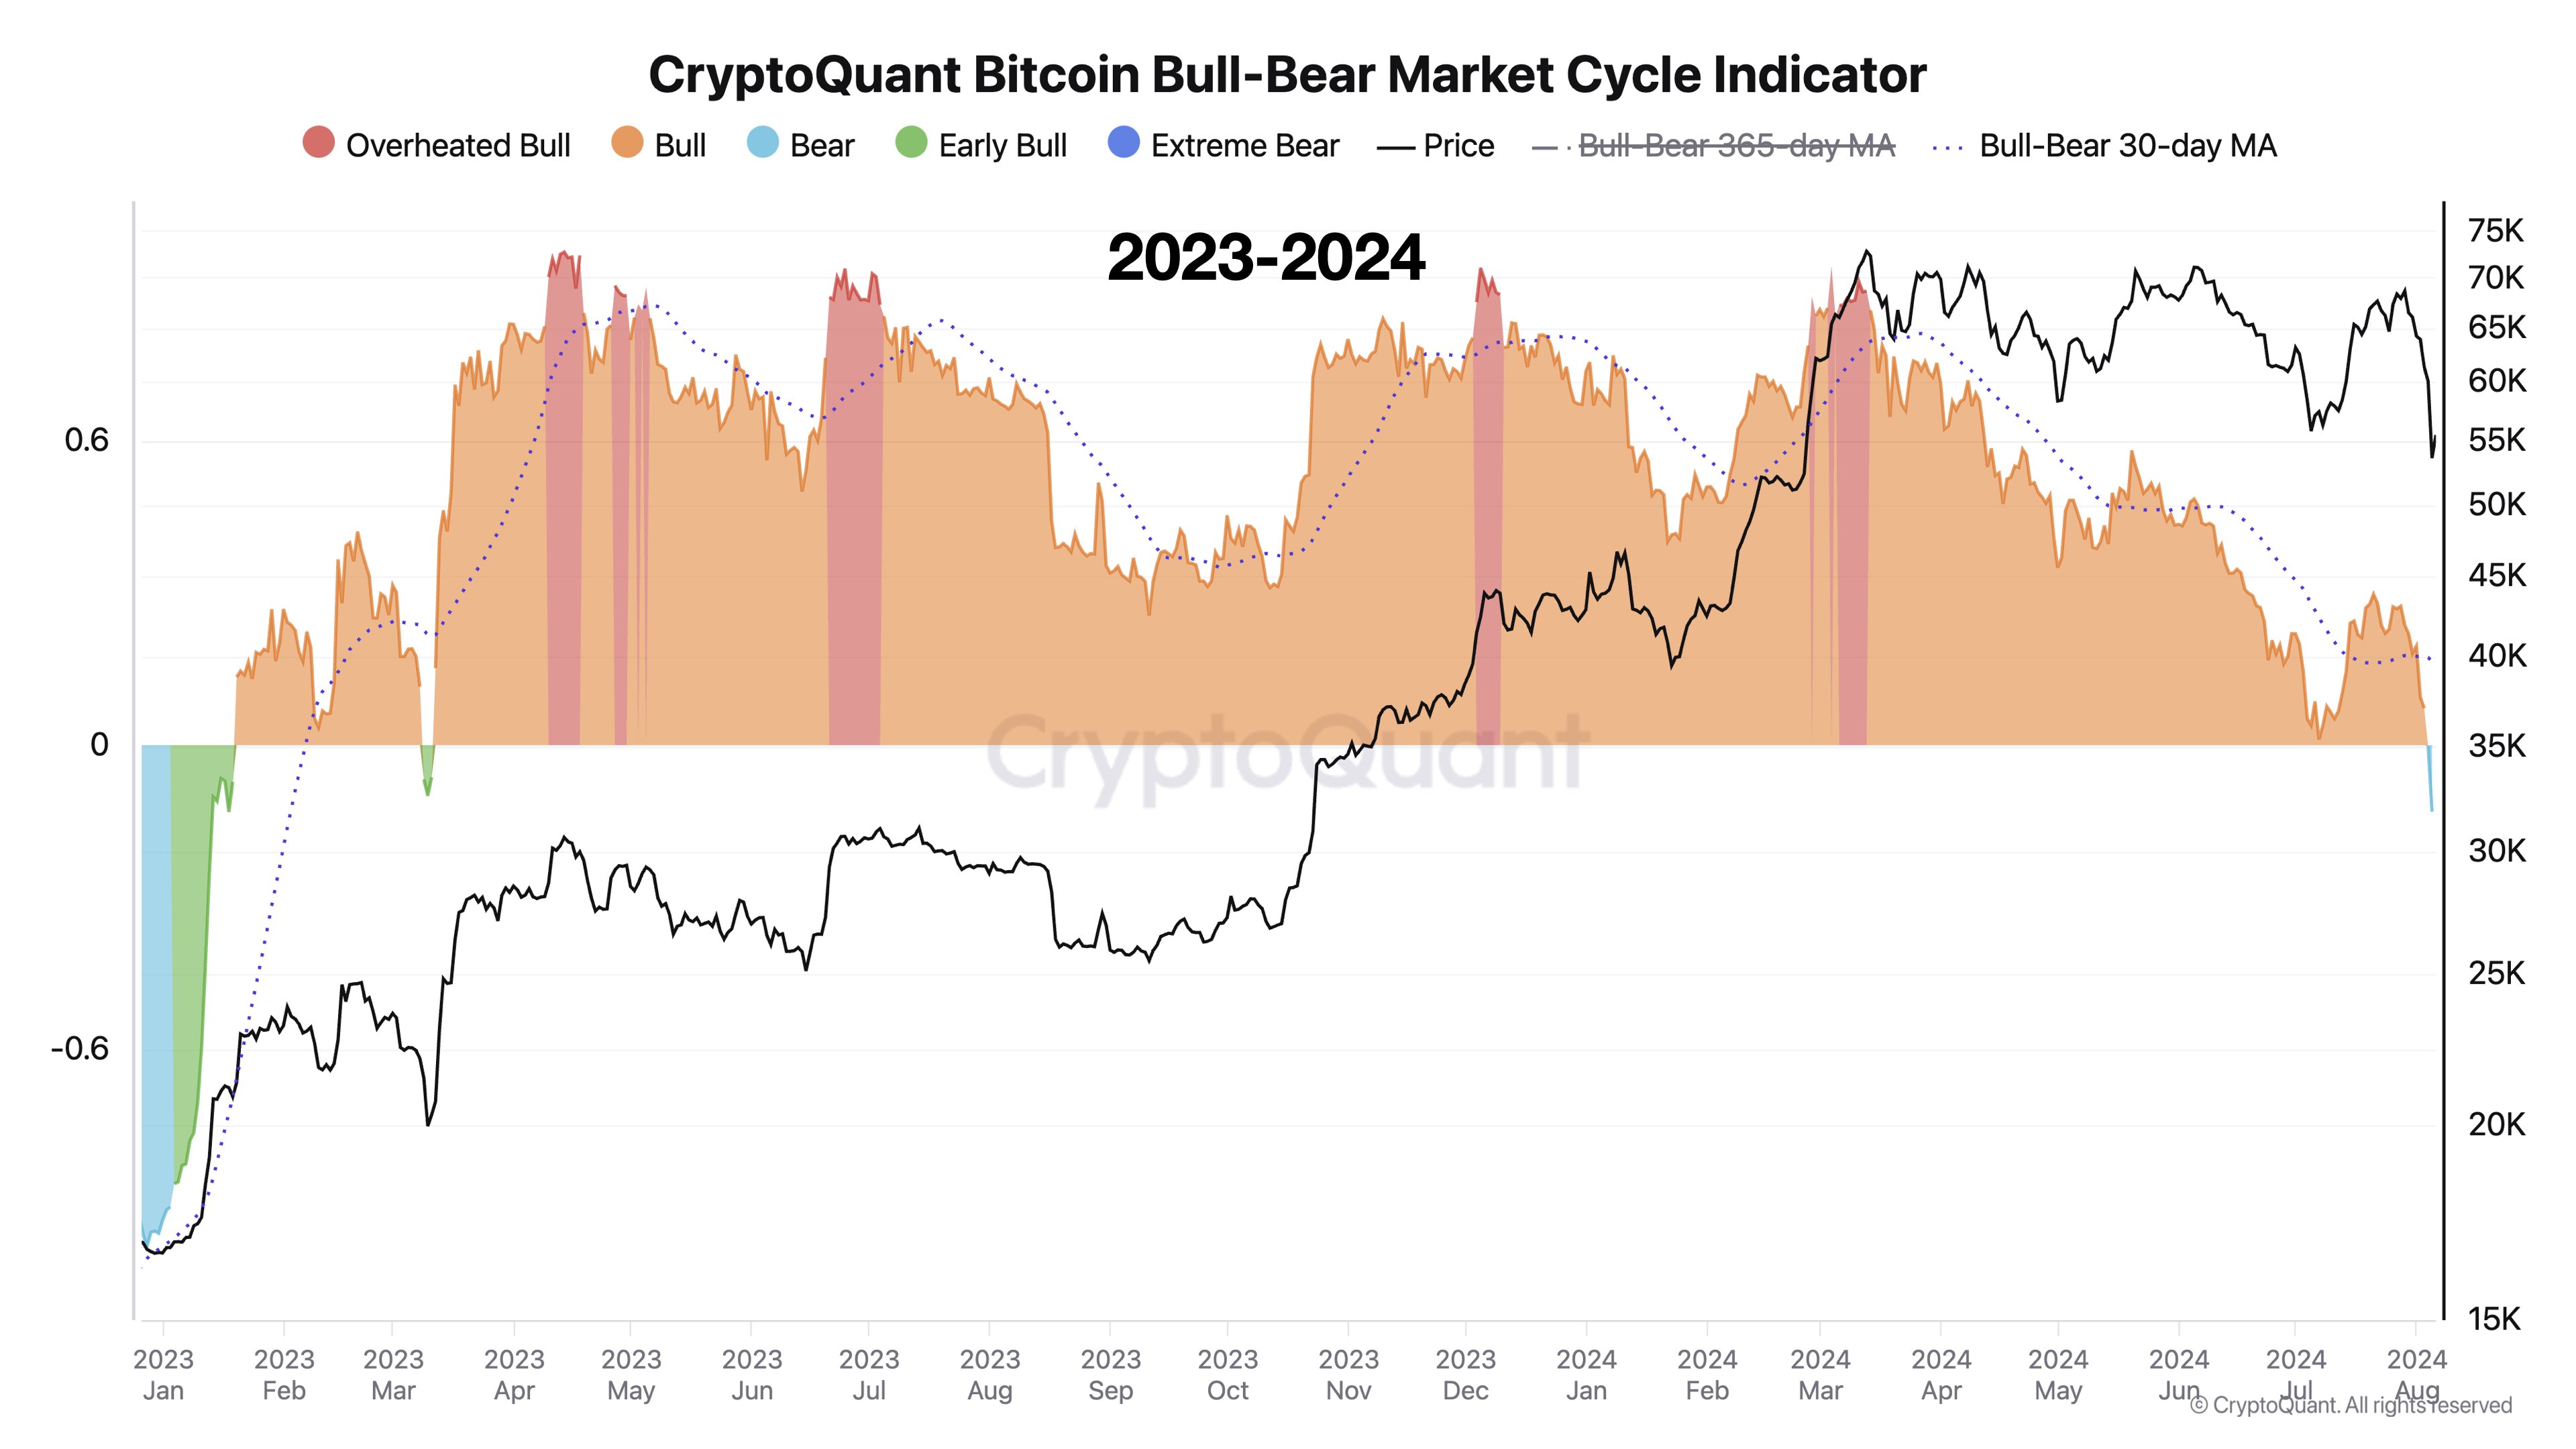
The value of the metric appears to have plunged into the negative territory in recent days | Source: @jjcmoreno on X
As displayed in the above graph, the Bitcoin Bull-Bear Market Cycle Indicator had shot up earlier in the year when the asset’s price had rallied to a new all-time high (ATH) and reached a territory called the “overheated bull.”
At these values, the P&L Index gains a significant distance over its 365-day MA, hence why the asset’s price is considered to be overheated. Alongside these overheated values, the asset had achieved a top which continues to be the peak of the rally thus far.
After spending months inside the normal bull territory, the indicator appears to have seen a plunge below the zero mark, implying that the P&L Index has now crossed under its 365-day MA.
The Bull-Bear Market Cycle Indicator is now flagging a bear phase for Bitcoin. Moreno notes that this is the first time since January 2023 that the metric is giving this signal.
Something to keep in mind, however, is that this signal doesn’t necessarily have to mean that the cryptocurrency is heading into an extended bear market. As the CryptoQuant head has pointed out, there have been periods in the past where the metric has only temporarily flagged a bearish phase for BTC.
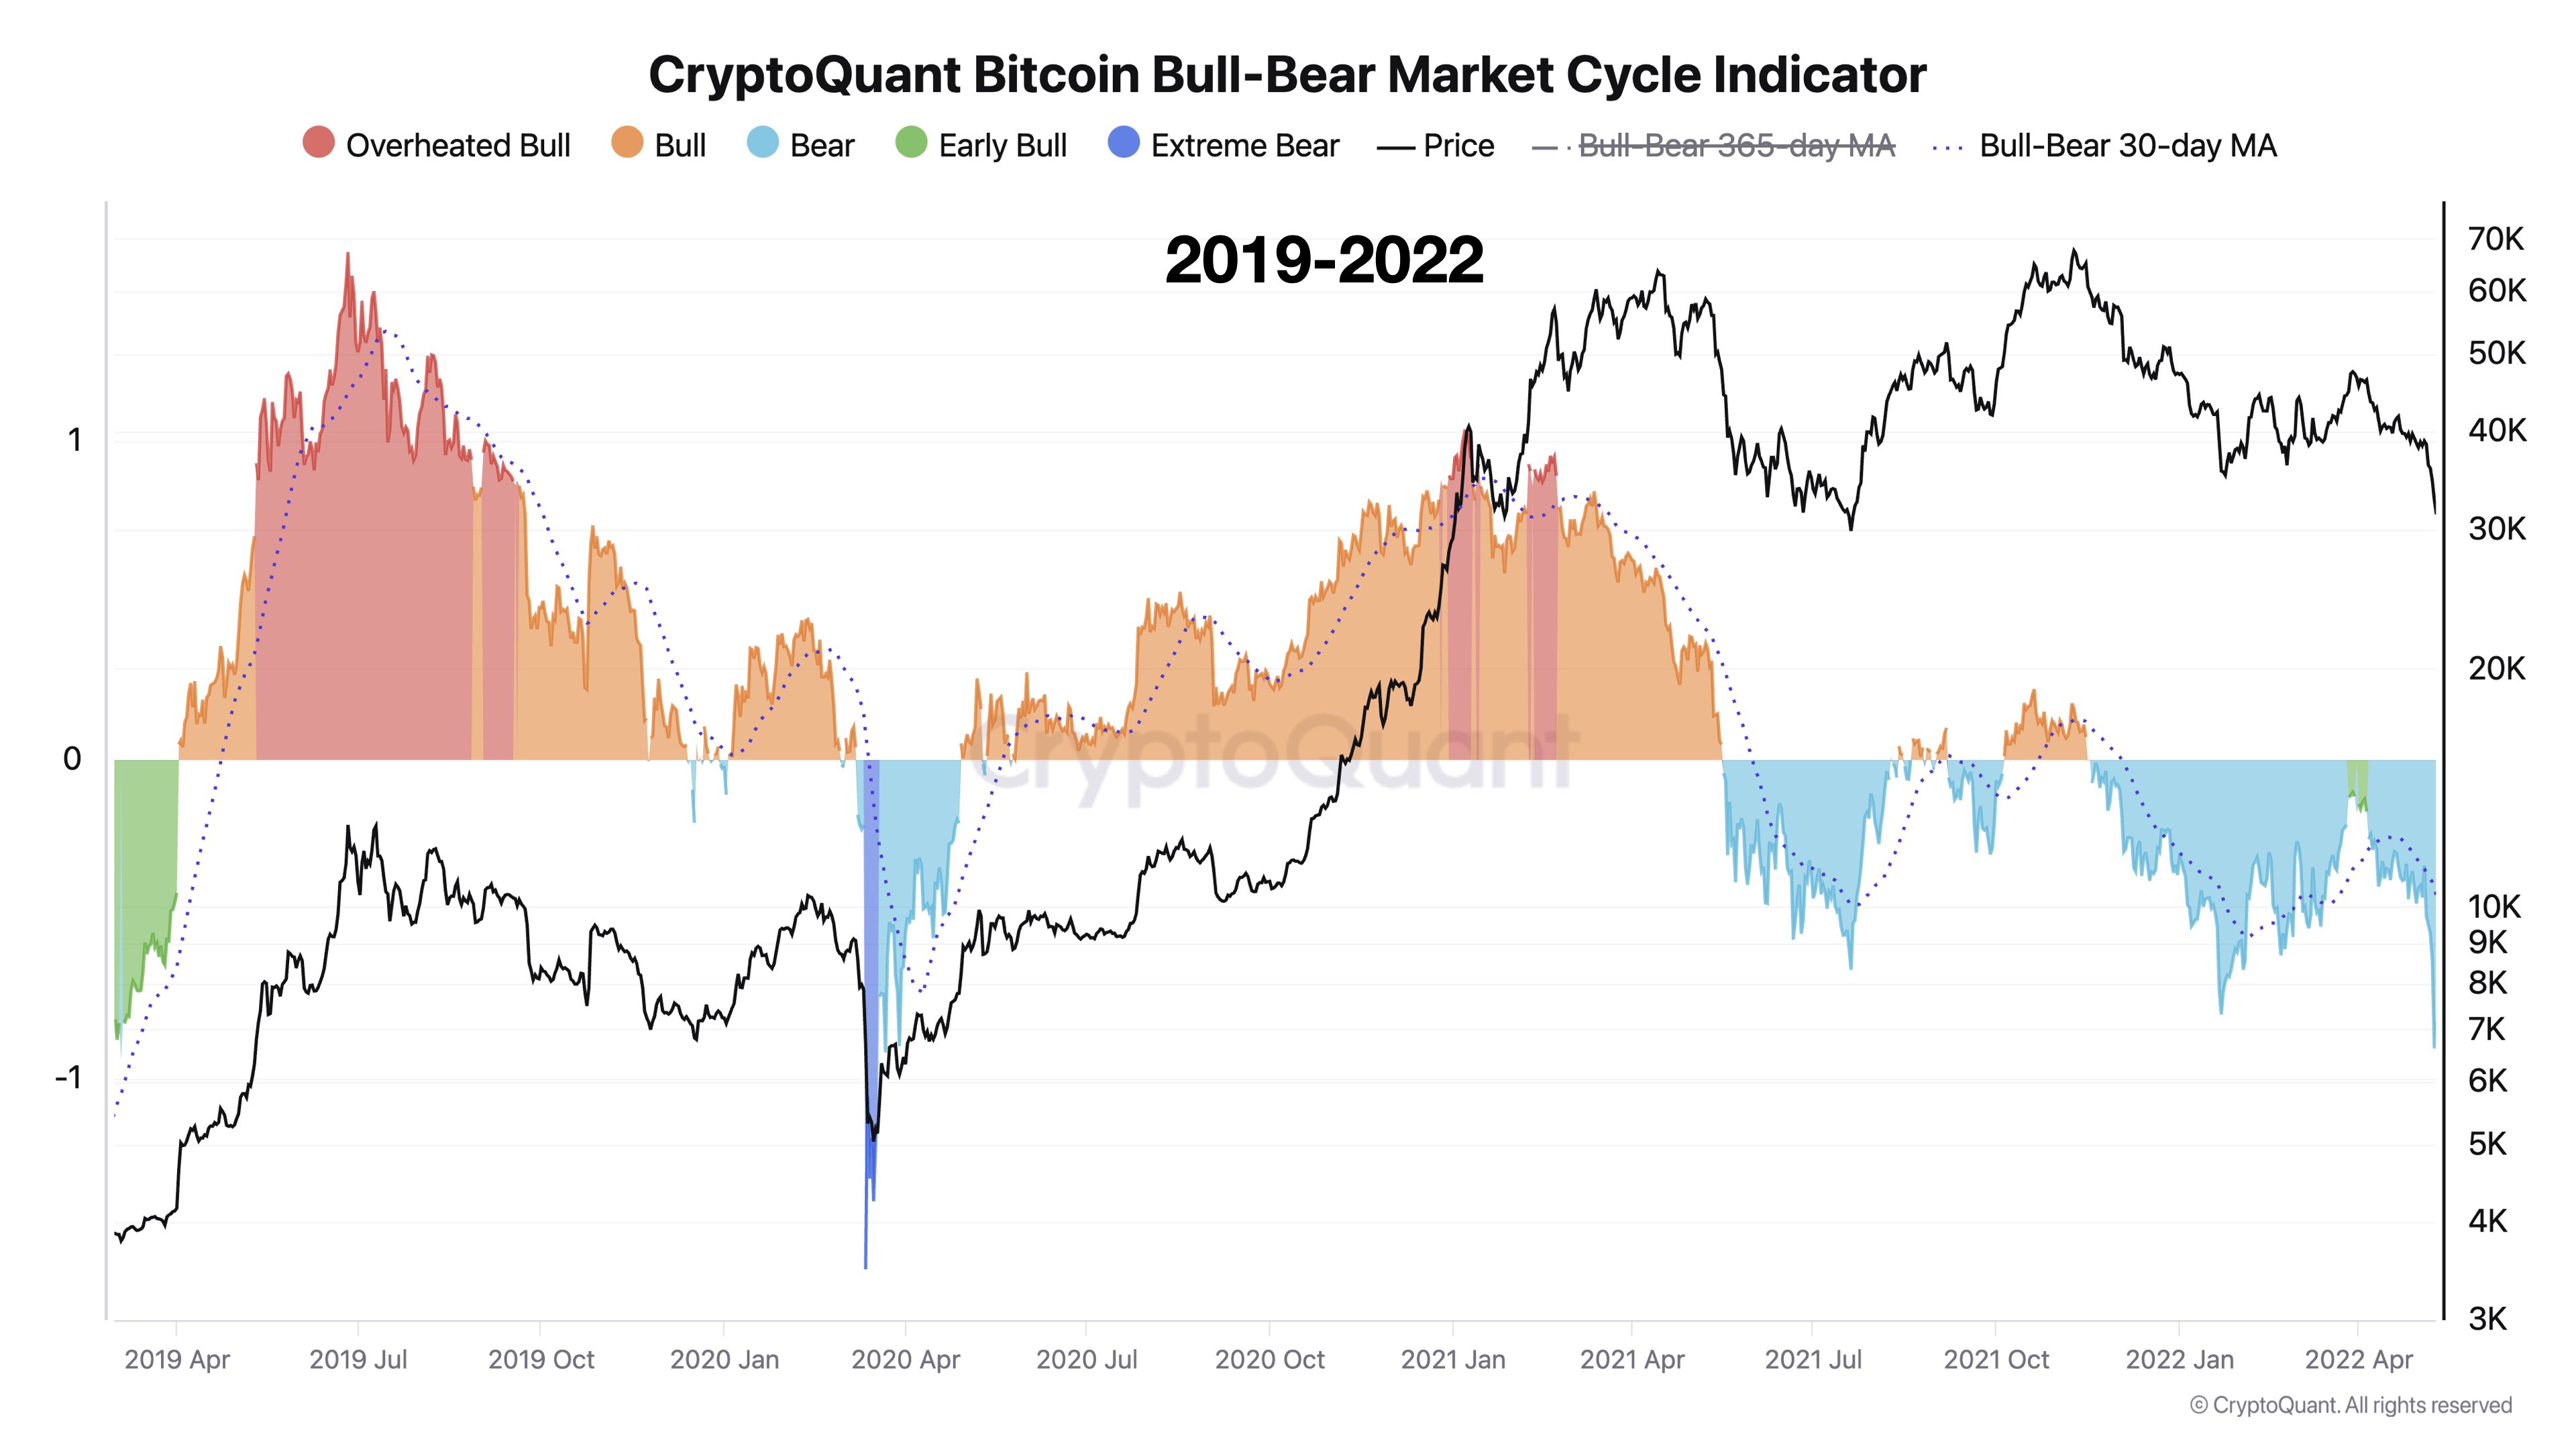
The previous bear phases for the asset | Source: @jjcmoreno on X
From the chart, it’s apparent that the COVID-19 crash in March 2020 and the China mining ban in May 2021 both led to temporary bear phases from the perspective of the indicator.
It now remains to be seen if the Bitcoin Bull-Bear Market Cycle Indicator will remain inside the negative territory for only a brief period this time as well or not.
BTC Price
At the time of writing, Bitcoin is trading just under the $57,000 level, down almost 14% over the last seven days.
Looks like the price of the coin has been making recovery since the crash | Source: BTCUSD on TradingView
Featured image from Dall-E, CryptoQuant.com, chart from TradingView.com