tum3123
WisdomTree Emerging Markets High Dividend Fund (NYSEARCA:DEM), launched on July 13, 2007 by WisdomTree, Inc. and managed by Mellon Investments Corporation and WisdomTree Asset Management, Inc., is an ETF that tracks the performance of the WisdomTree Emerging Markets High Dividend Index. It has $2.92B in AUM and distributes quarterly.
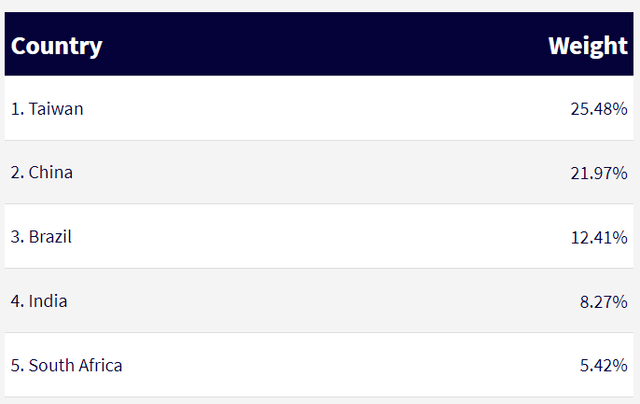
The methodology of the index is sound in most ways and has resulted in a significantly higher dividend yield than what you could get with a vanilla EM ETF. However, the dividend-weighting approach creates as much risk as its vanilla counterparts because of the very high concentration in Taiwan and China. Keep reading because this may or may not be a reason for you to reject DEM as a fitting addition to your income-focused portfolio.
Inclusion Criteria
The ETF’s benchmark index uses the WisdomTree Emerging Markets Dividend Index (parent index) as its available universe, so let’s first take a look at how the latter approaches selection.
The parent index starts with all EM companies that pay regular cash dividends on their common shares, but to be included each of them should have:
- a market cap of at least $200 million
- a minimum median daily dollar volume of $200,000 for each of the past 6 months from the screening date
- positive earnings over the past year
- paid a minimum of $5 million in cash dividends in the past 12 months from the reconstitution date
On top of those criteria, the parent index uses two factor scores to exclude the stocks that can be considered the riskiest: a quality and momentum factor. The quality factor uses fundamental metrics like ROE and ROA and calculates the score based on both static observations of the values of such metrics and how they have been trending over time. The momentum factor is based on the risk-adjusted total returns of each stock over certain periods. So, each stock is assigned a score that is the composite equally weighted score of these two factors; whichever falls within the bottom decile is excluded from the index. Moreover, stocks that fall within the top 5% based on dividend yield and the bottom half of the composite risk factor score are excluded as well. This is such an improvement over simplistic exclusions of the highest-yielding stocks, which ignore the context.
Lastly, the benchmark index selects those stocks from the parent which are ranked in the top 30% by highest dividend yield. When a constituent of the benchmark index is ranked outside the parent’s top 35% by highest dividend yield, it is deleted from the benchmark index.
Weighting Criteria
Though the selection process of the benchmark index is based on dividend yield, the weighting is based on the size of the annual dividend streams. The index uses the “cash dividend factor” to attribute weights, which equals the U.S. dollar value of a company’s annual cash dividend per share multiplied by its shares outstanding, adjusted for the free float.
This factor is calculated for every constituent and then summed. Each stock’s weight in the index equals its cash dividend factor divided by the sum of the cash dividend factors of all the stocks in the index. As you can understand, this is closer to a market-cap weighting approach than to a value one. The bigger the enterprise, the larger its dividend streams and the greater its weight will be.
On the bright side, this can provide more stability when it comes to the income generated by the ETF as the larger the company is, the more mature its business is and the less likely that something will materially disrupt its cash flow and, therefore, its distributions.
To weight its stock, the index also ignores any “excess” dividends paid by a company when its dividend yield is more than 12% by redefining its dividend stream (dividend per share x shares outstanding) as its market cap multiplied by 12%. So, this is another way in which the methodology proves to be very conservative.
Last, the index has some allocation rules in place to manage risk:
- No stock should have a weight greater than 5%.
- If a specific country or sector reaches a weight that is greater than 25%, the country’s or sector’s constituents’ weights will be proportionally reduced so that the country’s or sector’s weight goes back to 25%. Chinese domestic stocks are capped at 5% and the real estate sector is capped at 15% instead, probably because they are considered riskier.
Performance & Cost
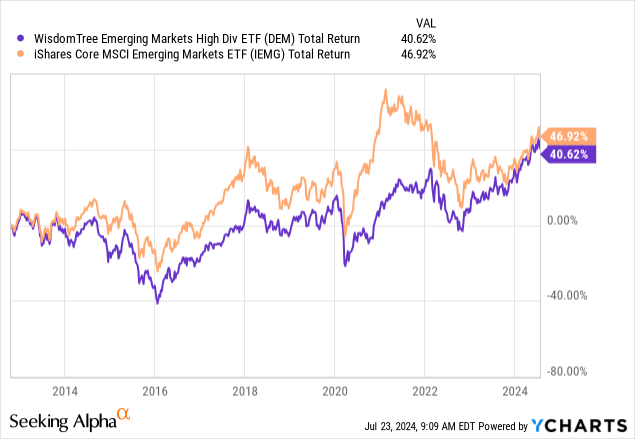
DEM has realized a 3.80% NAV annual return since it was launched. On a total return basis, it underperformed one of its vanilla EM counterparts, the iShares Core MSCI Emerging Markets ETF (IEMG), only slightly over the years:

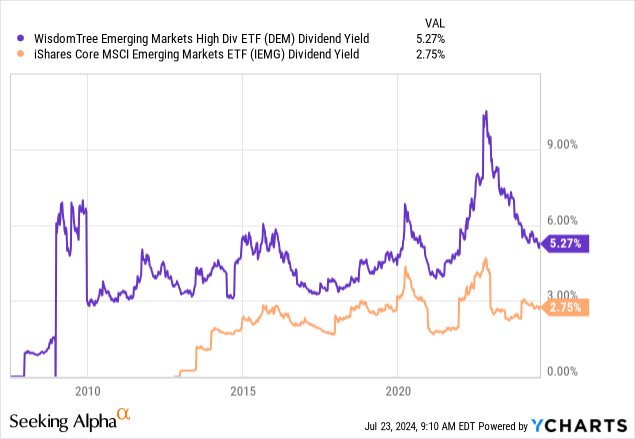
And that reflects a very decent performance considering that the dividend yield spread here is significant and always has been:

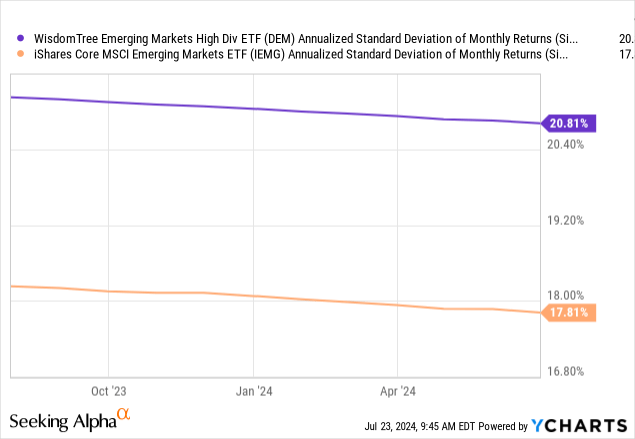
DEM has provided its returns with more volatility than IEMG, but not by much more and certainly not too much on an absolute basis:

Lastly, while DEM’s expense ratio of 0.63% is much higher than IEMG’s and both its turnover ratio and daily trading volume imply higher expenses, the difference in valuation is huge here:
| ETF | P/E | P/B | Expense Ratio | Turnover | Daily Volume |
| DEM | 8.24 | 1.08 | 0.63% | 43% | 300,431 |
| IEMG | 15.94 | 1.87 | 0.09% | 21% | 7,625,050 |
With an earnings multiple of only 8.24x and a book value premium of 8%, it appears that the inclusion methodology of DEM results in undervalued picks. It’s this margin of safety implied by its valuation that makes this ETF attractive right now.
Risks
Of course, this attractiveness must be weighed against the risks so that its current price represents an opportunity. The first risk you should consider is related to its concentration in Taiwan and China which is significant:
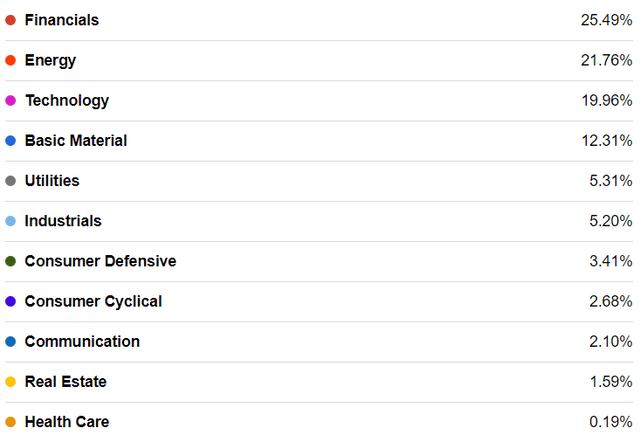
The second risk comes from a concentration in the Financials, Energy, and Technology sectors:
Lastly, you have to consider your investment horizon/approach here because DEM’s methodology is not designed to bring very attractive income streams in the long term, but offer a value tilt to your EM exposure. Even though the yield right now is high, consider that DEM doesn’t filter based on dividend history, payout ratio, and general solvency metrics. Therefore, DEM could prove unreliable when it comes to its dividend returns in the long term.
There is also a currency risk present here, but this is applicable to other EM funds too.
Verdict
This is one of the cases where it’s not absolutely clear to me that the ETF can be a good addition to an income portfolio. The risks don’t seem to outweigh the prospects of getting more or less accurate exposure to emerging markets with a dividend tilt. But it’s the country concentrations that concern me the most, so I am rating DEM a hold.
You, of course, could have a different opinion, so I encourage you to consider whether the dividend tilt approach provides enough value to your portfolio, and don’t forget to share your thoughts in the comments. Thank you for reading.

