Luis Alvarez
Dimensional has a strong reputation for its factor-based approach to investing, providing strategies and funds that have a chance at outperforming core passive benchmarks. I emphasize the word “chance” here because as we know, anything that isn’t passive tends to have a hard time being worth investor attention. Having said that, I do like their equity offerings.
If you’re a fan of Dimensional and looking for something different than the traditional core passive equity averages, then you may want to consider the Dimensional U.S. Equity ETF (NYSEARCA:DFUS). The fund has a long history dating all the way back to 2001, and has grown to over $9.6 billion in assets. It benchmarks against the Russell 3000 Index, which means it will have small and mid-cap companies in the mix.
A Look At The Holdings
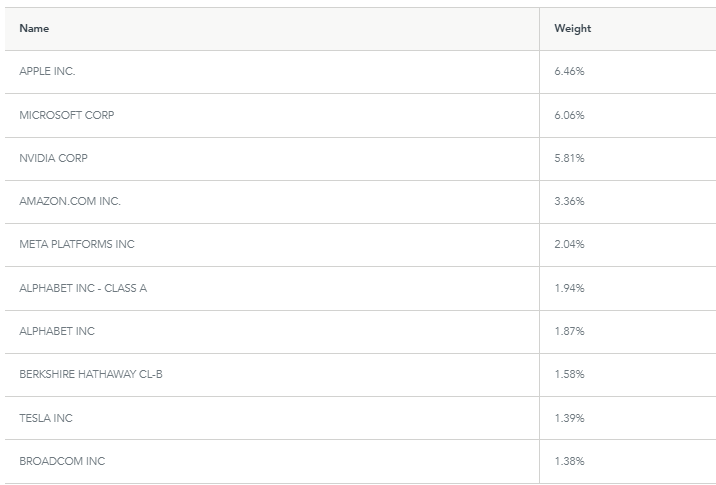
DFUS includes nearly 2,500 different companies, giving investors access to a broad cross-section of the US equity market. No position makes up more than 6.46% of the fund, and the top 10 positions are all the mega-cap familiar names you certainly recognize.
dimensional.com

This alone makes this clearly more of a core equity portfolio, given it essentially looks like the S&P 500 or Russell 3000 (albeit with slightly more balanced overall weights in the top 10). There’s nothing wrong with that, but it’s good to keep in mind when thinking about where a fund like this fits into an overall portfolio.
Sector Weightings
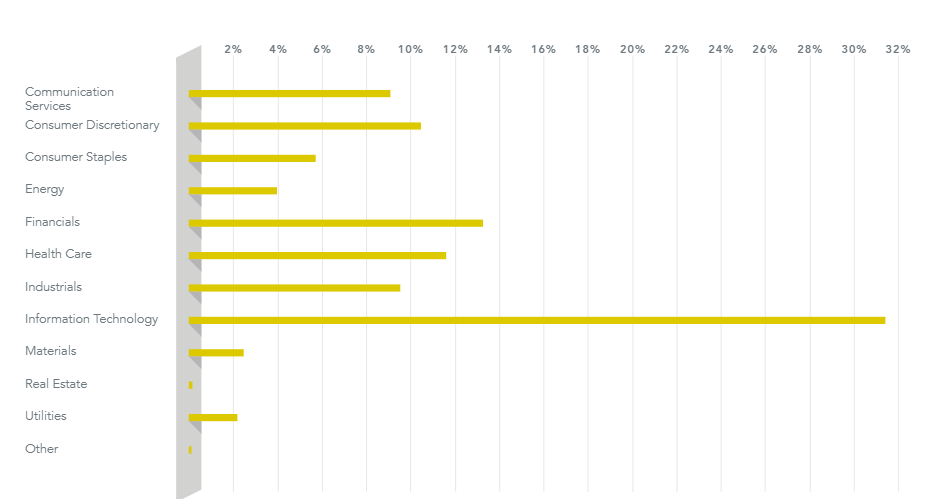
Because this is more of a core US fund representative of the Russell 3000, it should come as no surprise that Tech is the biggest allocation, followed by Financials. The sector weightings don’t veer too dramatically from what you see in the Russell 3000 benchmark itself, so no major tracking issues from that perspective.
dimensional.com

This is one thing I’m not a fan of, though it doesn’t have anything to do with Dimensional. I’m worried about Tech overexposure this late in the cycle, and suspect that it becomes more of a laggard over time. Again – not a knock on DFUS, but something that, I think, will matter going forward from a return expectations perspective.
Peer Comparison
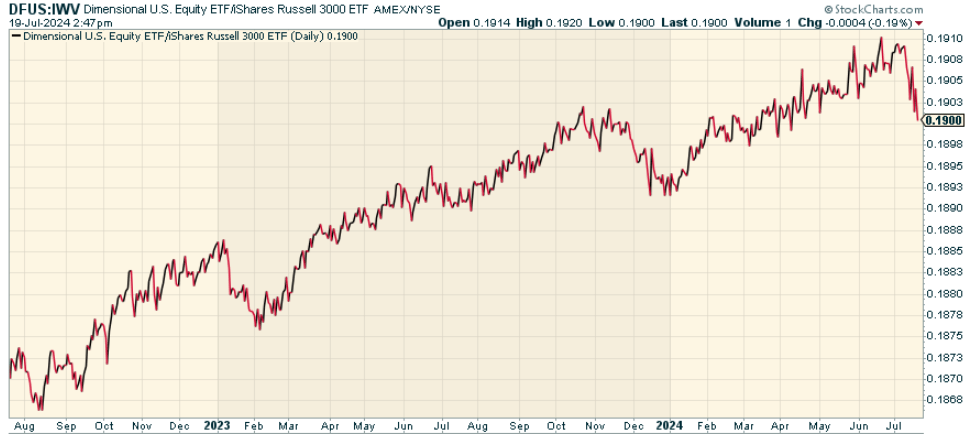
To put it mildly, there are a lot of competitors in this space. Since the fund’s benchmark is the Russell 3000, it’s worth comparing the portfolio to the iShares Russell 3000 ETF (IWV). When we look at the price ratio of DFUS to IWV, we find that DFUS has outperformed IWV over the last two years (though not in a huge way). Dimensional’s approach does seem to add some alpha at the margin against its benchmark.
StockCharts.com

Note that I think the key to this going forward will be how Dimensional treats its smaller-cap companies. I suspect there’s a period of outperformance ahead, which means it will matter for DFUS to potentially overweight that part of the marketplace if I’m right to continue its edge.
Pros and Cons
On the positive side? As mentioned just above, the fund does seem to outperform over time. As a core allocation, the approach adds value, and is cheap at a 0.09% expense ratio. You know what you’re getting here, and it’s not going to dramatically differ from what you’d normally get from other broad-based equity funds out there.
The downside? I think it’s more a cycle question than a product one. If stocks enter a correction or bear market, the outperformance potential won’t matter because this fund would get hit just like every other one. The Tech sector allocation, as I mentioned, is problematic to me. Yes, it’s par for the course when it comes to a total market proxy, but that’s also what makes the fund not as appealing to me here.
Conclusion
There’s nothing wrong with the Dimensional U.S. Equity ETF. It’s outperformed the Russell 3000, has a long history, and has one of the most respected firms behind the fund. I just don’t know if it’s worth rotating out of one core equity fund you already have exposure to into this one. I would consider this fund after a larger dislocation in equities. Good overall regardless.


Are you tired of being a passive investor and ready to take control of your financial future? Introducing The Lead-Lag Report, an award-winning research tool designed to give you a competitive edge.
The Lead-Lag Report is your daily source for identifying risk triggers, uncovering high yield ideas, and gaining valuable macro observations. Stay ahead of the game with crucial insights into leaders, laggards, and everything in between.
Go from risk-on to risk-off with ease and confidence. Get 50% off for a limited time by visiting https://seekingalpha.com/affiliate_link/leadlag50percentoff.


