Dogecoin (DOGE), the largest meme-based cryptocurrency by market capitalization, has recently formed a second low, suggesting that the meme coin could be gearing up for a potential 4,000% rally to new all-time highs above $4.
Dogecoin Second Low Could Signal Big Gains Ahead
Trader Tardigrade, a crypto analyst, told his 55,100 followers on X (formerly Twitter) that Dogecoin has officially formed a second low after touching a crucial support level. He shared a price chart illustrating Dogecoin’s price movements since 2014, highlighting periods where the meme coin had formed a first and second low after hitting a key support level, which then led to a massive price surge.

From 2014 and 2017, Dogecoin found support in 2015, followed by a second low in 2017, which triggered a substantial price rally that same year. A similar pattern played out between 2018 and 2021, with Dogecoin reaching a critical support level in 2020, forming a second low in 2021, and then skyrocketing in value that year.
Following this historical trend, Trader Tardigrade questions whether Dogecoin might follow a similar price pattern or if this time will be different. The cryptocurrency has already hit a key support level in 2023, and recently established its second low, hinting that it may be preparing for a dramatic price increase.
Reviewing the price chart, the analyst points to a rally to the upside, suggesting that DOGE could potentially witness a staggering 4,000% price surge above $4 during this bull cycle.
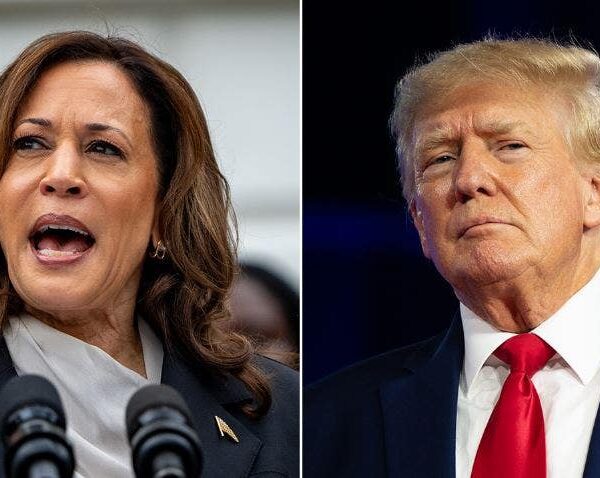
When asked by a crypto community member if this bullish price breakout might occur on November 6, after the end of the United States Presidential elections and a potential Donald Trump win, Trader Tardigrade responded simply with, “Not a bad guess.”
The analyst has remained highly optimistic about Dogecoin’s future outlook, suggesting in a previous X post that Dogecoin may have finally reached its bottom in the current market downtrend, with indications of a major bullish crossover on the horizon.
Bullish Divergence Points To Potential Upside
Popular crypto analyst, Ali Martinez has identified a unique technical pattern in the Dogecoin price chart. Martinez disclosed that Dogecoin is currently showing a bullish divergence against the Relative Strength Index (RSI) on the 4-hour chart.

A bullish divergence occurs when the price of a cryptocurrency is making new lows while its RSI is hitting higher lows. This discrepancy is seen as a sign that the market is gaining strength, characterized by weakening selling pressure that could lead to a potential price reversal.
Martinez has also revealed that Dogecoin’s TD indicator was flashing a buy signal, suggesting that current conditions may be favorable for a possible upward price movement. At the time of writing, the price of Dogecoin is trading at $0.096, reflecting a 2.53% decrease in the last 24 hours, according to CoinMarketCap.
Featured image created with Dall.E, chart from Tradingview.com