
Dogecoin is making waves once again, with bulls stepping up after a key trendline breakout that could ignite a fresh rally. Following a period of sideways movement, the momentum has shifted in favor of buyers, who now have their sights set on the $0.1293 target. This breakout could mark the beginning of a significant uptrend, but the real test lies ahead – can the bulls keep the momentum going, or will overhead resistance stall their charge toward new highs?
This article seeks to analyze Dogecoin’s recent trendline breakout and its potential for further upside. We’ll dive into the technical indicators driving the bullish momentum, assess key resistance levels, and determine whether the bulls have enough strength to push the price toward the $0.1293 mark.
In the past 24 hours, DOGE was trading near $0.1068, marking a 4.68% increase. The cryptocurrency’s market capitalization has climbed above $15.5 billion, while trading volume exceeded $717 billion. During this period, both the market cap and the trading volume saw a boost of 4.70% and 71,33% respectively.
Technical Indicators Signal Strong Bullish Potential
Recently, Dogecoin’s price action on the 4-hour chart has turned bullish following a breakout above a key trendline. The price is now consolidating above the 100-day Simple Moving Average (SMA), signaling that the bulls are maintaining control.
Specifically, the positioning above the 100-day SMA often reflects underlying bullish momentum, and if this trend continues, it could pave the way for further upside movement. However, a breakout from this consolidation range will be crucial to determine the next leg of the rally.
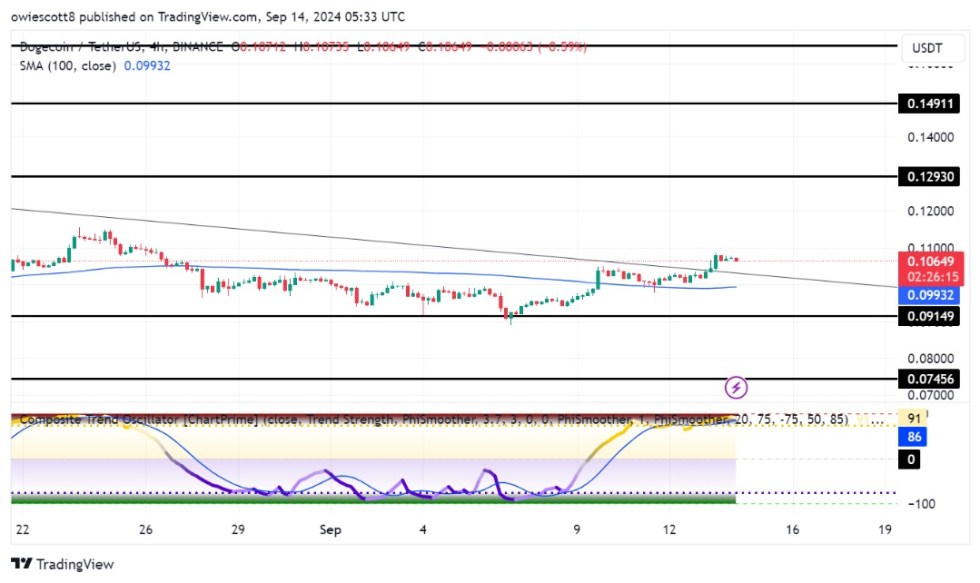
An analysis of the 4-hour Composite Trend Oscillator shows that the bulls are firmly in control of the market. Both the signal line and its SMA have moved into the overbought zone, indicating strong upward momentum. This positioning suggests that the current bullish trend still has room for growth, with the potential for Dogecoin’s price to climb even higher in the near term.
Also, on the daily chart, DOGE, after breaking above the bearish trendline, is currently attempting a move toward the 100-day SMA. With this recent upward momentum and the trendline breakout, the digital asset could extend its rally toward the $0.1294 resistance level.

Finally, on the 1-day chart, the composite trend oscillator also indicates a rising positive strength for the cryptocurrency as the signal has crossed above the SMA of the indicator and both lines are attempting to move out of the oversold zone toward the zero mark.
Upside Potential Vs. Downside Risks: What’s Ahead For Dogecoin?
Dogecoin’s recent bullish momentum presents strong upside potential, especially after breaking above a key trendline. If the price can maintain its position above the 100-day SMA, a move toward $0.1293 and other resistance levels seems likely.
However, downside risks remain, including overbought signals on key indicators that could lead to a short-term pullback toward the $0.09149 support level. A breach below this support level could signal a deeper bearish trend, leading to additional price declines towards other lower levels.
Featured image from Unsplash, chart from Tradingview.com