Pgiam/iStock via Getty Images
Investment thesis
Founded in 1947 and based in Illinois, Dover Corporation (NYSE:DOV) is a diversified manufacturing company with an extensive product portfolio of engineered and non-engineered products. It sells its offerings into the consumable supplies, aftermarket, software and digital markets. It operates through five operating segments: 1) engineered products, 2) clean energy & fueling, 3) imaging & identification, 4) pumps & process solutions, and 5) climate & sustainability technologies.
Figure 1.
Sales of $6.9 billion in FY’15 were on $976 million in operating earnings, stretching to $7.1 billion on $1 billion pre-tax in FY’19, and $8.4 billion last year on $1.4 billion of operating income [2.4% and 4.8% CAGR, respectively].
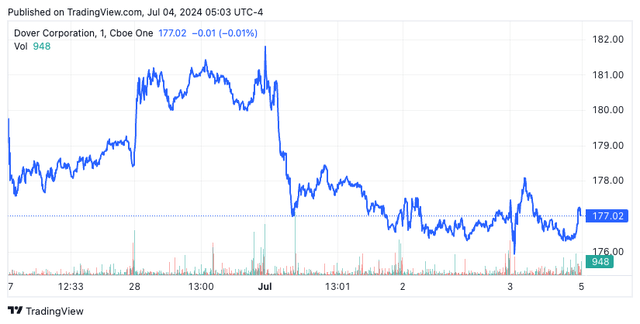
DOV stock has rallied ~15% this YTD driven by earnings growth and revised expectations [+11 EPS revisions in the last 3 months] but investor expectations are equally as high buying DOV at 19.5x trailing EBIT and >4.5x book value. The margin for error is low at these multiples.
I am hold on DOV due to 1) attractive economics [higher than industry pre-tax margins, persistence in ROIC>12% hurdle rate, increasing FCF and economic earnings], 2) capital allocation [dividend growth, ~$500 million buyback program], 3) reduced competitive advantage period despite this strength [faster implied fade rate of ROIC, lack of reinvestment opportunities], and 4) estimated valuation range of ~$180–$190/share, little margin of safety on current levels. Net-net, rate hold.
Stable business characteristics
DOV is a bastion that is 1) highly cash-productive, and 2) appropriately capitalized [~$5.1 billion of equity holds up ~$11 billion of assets, with ~$3 billion LT debt]. Management exhibits a firm grasp over the balance sheet in my view and unlocks shareholder value in 4 primary ways – (i) reinvestment of retained earnings, (ii) mining the acquisition pipeline, (iii) shedding equity capital via dividends, and more recently, (iv) buying back stock. Management launched the ~$500 million on market buyback in February to repurchase shares [equal to ~2.2% of the company at 1st Feb. market cap of ~$21.9 billion].
Some of the additional high-quality characteristics I have identified for DOV include the following:
-
The company enjoys consumer-like advantages – via its cost-differentiation pricing strategies along with operating efficiencies given 1) economies of scale, 2) economies of scope with complementary product lines, and 3) specific brand-like advantages in highly competitive commodity-like segments [being around since 1947 helps establish presence]. The advantage is evidenced in higher pre and post-tax margins vs. industrial machinery and supplies industry peers (Figure 2). Gross margins are in-line with peers [indicating products are sold in-line with industry averages] on ~16.6% operating margin vs. an industry ~5% [indicating OpEx vs. sales is
- Higher than industry average post-tax margins drive the returns produced on the capital required to operate DOV’s business routinely >15% – persistently high operating margins drive equally persistent earnings on capital employed in the business [~15% average, on ~1x capital turns]. Each $1 of capital put into operations returns ~$1 in sales, thus is 1) highly efficient and 2) highly profitable. The business earns ~$9.20/share on capital of ~$60/share as of the 12 months to Q1 FY’21, a ratio that’s held firm since ’21. The bulk of incremental investment directly into the underlying business from FY’21–’24 is tied up in NWC, followed by fixed capital. To produce a new $1 of sales in that time, management invested ~$0.48 to working capital and $0.15 to fixed assets. Outside underlying operations, it also committed ~$1.06 per new $1 of sales to acquisitions in the same period. This is positive as 1) acquisition-related revenues lead organic revenues [we saw this in Q1 FY’24], and 2) it suggests that new investments are somewhat pulling their economic weight.
Figure 2.
Company filings, Seeking Alpha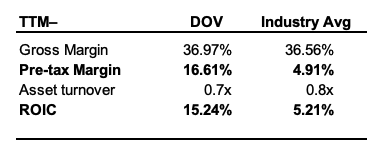
Figure 3.
Company filings, author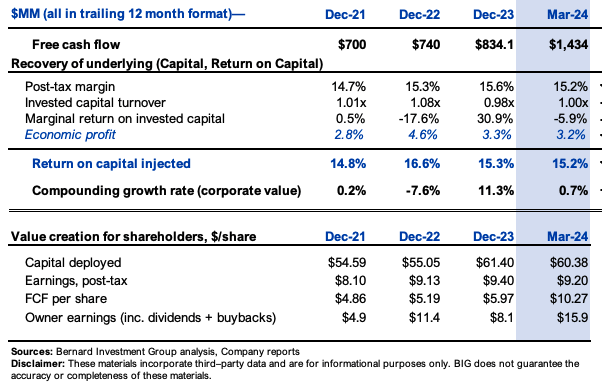
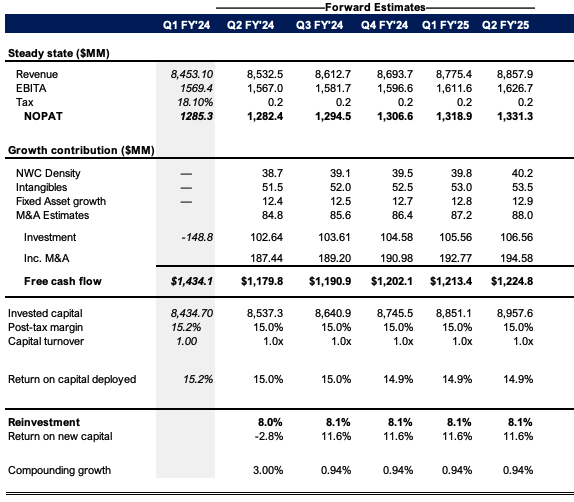
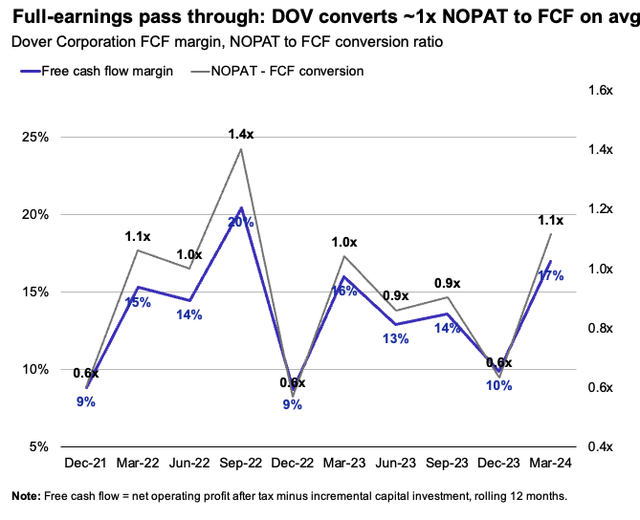
- The operating model is highly FCF productive and DOV throws off ~1x post-tax earnings in free cash flow after all capital requirements to maintain its competitive position and grow (Figure 4) – this is because 1) incremental capital requirements into core operations are relatively low, and 2) management focuses heavily on acquisitions to grow. Reinvestment rates [percent of NOPAT retained + reinvested to next year’s capital base] average ~40%p.a. since FY’21–’23, but look to reduce substantially from FY’24 as (i) management focuses on buybacks + dividend growth instead, and (ii) a lack of viable opportunities to mine the acquisition pipeline. I project ~$1 billion in FCF rolling forward as management redirects capital to these sources. Future dividend growth is unquestionable based on these facts, in my opinion.
Figure 4.
-
Performance in key segments: In Q1 FY’24, engineered products sales were up by 9.2%, and the pumps & process solutions business grew 4.5%. Acquisition-related sales registered ~200 basis points growth to the top-line, which partially offset a 130 basis point decrease in organic revenue.
Moderately attractive valuation – advantages look well captured
I find shares of DOV to be of only moderate attraction based on my estimates of 1) economic earnings, 2) a reduction in competitive advantage period (“CAP”), and 3) the potential for multiples contraction moving forward.
Specifically, my analysis indicates DOV’s outsized return on capital, CAP, and growth metrics are already well recognized by the market. The stock looks fully priced at 3.2x EV/IC and 21.3x trailing NOPAT as I write, and estimates get me to a range of $180–$190/share under various scenarios.
Valuation insights
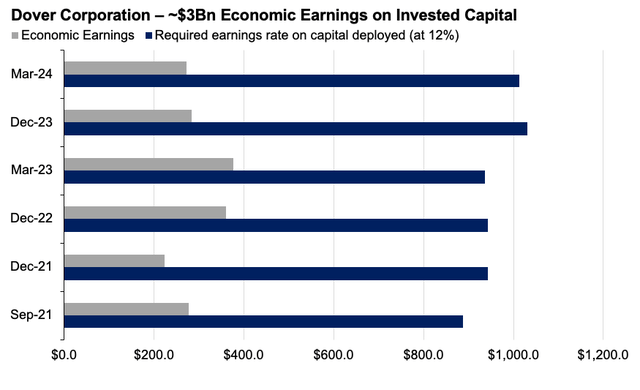
- It’s a question of value creation vs. wealth creation for DOV as 1) management are producing >$250 million in economic earnings on invested capital each rolling 12 months, which is 2) roughly 2–4% of sales in any given 12-month period (Figure 5). DOV did $2.96 billion or ~$22.80/share in economic profit from FY’21–Q1’FY24 [here all capital invested in DOV’s business is indexed at a 12% capital charge. This is the long-term market avg. return].
Figure 5.
Figure 5a.
- Thus it created economic value, but the propensity to create shareholder wealth – i.e. increase market value – is hindered by several facts in my view. First, ~3x EV/IC is the market’s appraisal on DOV since FY’21. Investors increased the multiple paid on NOPAT from ~17x in FY22 to ~21.3x as I write (Figure 6). These imply high embedded expectations, meaning DOV must hit ~9-10% sales growth in FY’25 to justify the current premium, leaving minimal room for error. Further, even optimistically carrying these forward to my FY’26E estimates (see: Appendix 1) gets me to a valuation range of $180–$190/share (Figure 7) implying valuation symmetry and little scope for outsized returns. I am behind consensus FY’24 estimates of ~5% NOPAT growth on
Figure 6.
Company filings, Bloomberg
Figure 7.
Author’s estimates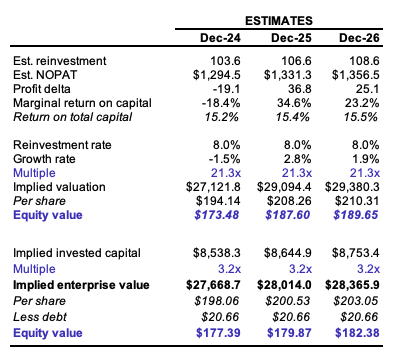
Figure 8. Consensus projects ~6.2% pre-tax growth, but I am behind this and get to ~$1.58 billion by FY’24. This could be an upside risk, but we have to remember valuations are already reflective of this growth, so to trade >21x NOPAT is unlikely in my view, but could sport >$189/share valuation if earnings exceed my estimates.
Seeking Alpha, Bloomberg, 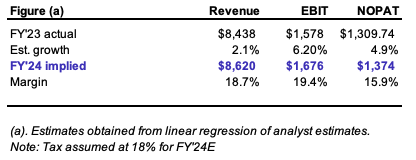
- Following Q1 FY’24 numbers, the implied CAP was -1.4 years to 3.35 years. The CAP is the expected life of DOV producing excess returns on its capital above our 12% hurdle rate [I estimate the market viewed ~4.8 years advantage over the 12%]. Investors now see ~10 points accelerated fade rate – that is, DOV’s ROIC reverting to an industry average ROIC [~5% in this instance]. They see DOV’s advantage waning quickly, despite still assigning high multiples.
Figure 8.
Author estimates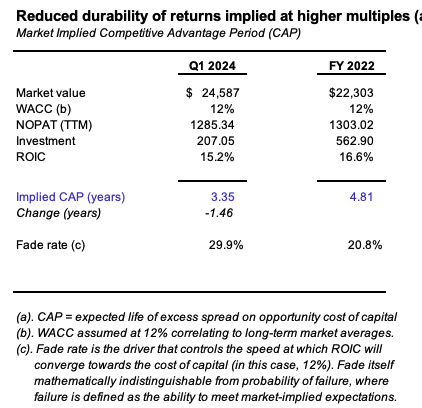
- The tighter CAP sees DOV’s future growth opportunities valued at ~1.7x vs. 9.2x in FY’22, a clear indication of the change in sentiment at such high valuations. Most of the firm’s value is tied up in current operations, at a commodity P/E of 8.3x [this assumes ROIC = 12%, i.e. 1/0.12 = 8.3x. It shows the multiple if DOV creates no further economic value]. This reappraisal justifies a multiple of 10x NOPAT or ~0.5x potential contraction from today. At FY’24 growth estimates of -1.47% (-18.4% marginal return on capital times 8% est. reinvestment rate), no change in shares outstanding + ~1.2% dividend yield, 12-month TSR would = 0.4% (Figure 10). We need earnings growth >5% to see $184/share in FY’24 at 19.1x NOPAT – if we slip 5% to 18.2x, this gets us to $176/share today, even with the 5% growth (Figure 11). I project ~2% decline, meaning we’d need ~20.1x NOPAT to see us trade fairly at $176 today under these assumptions. This appears unlikely.
Figure 9.
Author estimates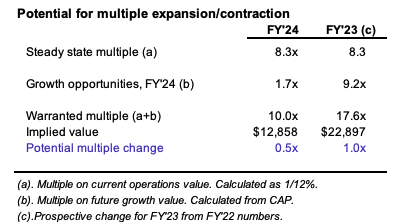
Figure 10.
Author estimates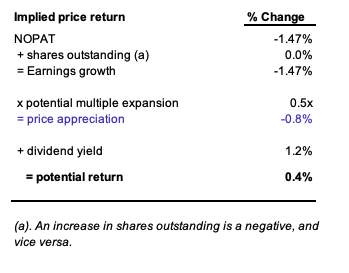
Figure 11.
Author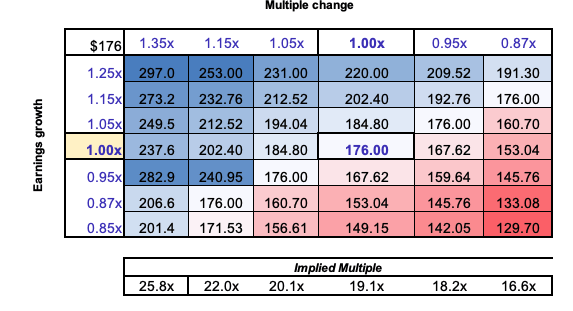
- Again $180–$190/share valuation range is supported on capital and economic earnings models. I project another ~$3 billion in economic profit above the hurdle rate in the next 3 years, producing ~$181/share in justified value discounted at 12% (Figure 12). The opportunity cost produces ~$208/share, $18/share difference implied value. Current economic profit + future estimated returns sees an improper recovery of our underlying asset – 1.01x return on $27.3 billion, indicating a recovery of capital, but no return on capital, supportive of a hold.
Figure 12.
Author estimates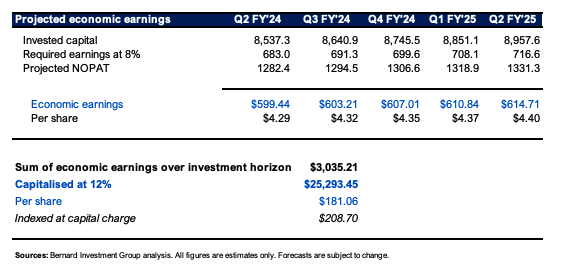
Author estimates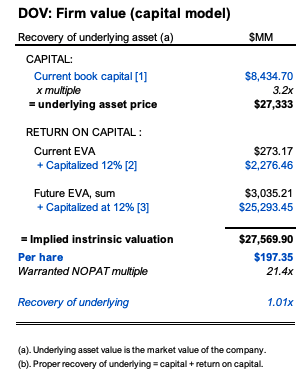
In short
DOV is a cash-producing machine that throws off piles of FCF to shareholders each quarter, funding 1) acquisitions, 2) dividends, and 3) buybacks. Business returns are strong and drive persistent spread above an opportunity cost of 12%. I am hold on DOV on valuation as the above points appear well reflected at 21x trailing NOPAT and ~3x EV/IC. Embedded expectations are high, and I see little margin of safety protecting the downside on valuation, thus skewing the risk/reward calculus out of our favour. DOV looks fairly valued ~180-$190, and by FY’26E this gets us 1-3% CAGR. Hardly attractive. Rate hold.
Appendix 1.
Author’s estimates