
primeimages/E+ via Getty Images
“a portfolio of quality businesses under the aegis of controlling shareholders”
Performance and net asset value
† after all ongoing management and performance fees.
Administrative notes:
Distribution
The distribution per unit XD on 30 June 2026 is $0.031927 (3.19c) mainly comprised of net capital gain.
Name change
The trust has changed its name to “Dynasty Trust” to reflect the recognition gained since we established the entity in late 2022 and we have a corresponding new logo.
Substack
We now run a substack Andrew Brown | Substack which allows us to write (with full disclosure and disclaimer) about companies and other issues where the content is at greater length than other social platforms but not to the depth of our quarterly reports. We have already commented on Bolloré, Frasers Group, Virtu and some wider issues in Australian banks.
Dynasty Trust NAV increased by 7.2% after all fees in the June 2026 quarter. We were still marginally impacted by the major performance influence of the twelve months to 30 June 2026 (Australian fiscal year, henceforth FY2026) being strength in the Australian dollar against virtually all currencies. We estimate over the course of the past year, the A$ has stripped over 6.5% from performance given that we choose NOT to hedge the currency.
The philosophy of not hedging the A$ is borne out by two features:
- the fact we benefitted by ~500bp in the prior financial year; and
- the rapid and opposing shift in interest rate perceptions in both Australia and the USA over the past two months.
This quarterly is in three parts:
- assessing the past quarter and twelve months and where we could have done better;
- a high-level examination of why we find travel businesses so interesting, attractive but often difficult from an investment standpoint; and
- a detailed assessment of a unique “travel” holding in our portfolio: the Australian company EVT Limited
On 28 July 2026, starting at 7am UK time (4pm Australian East Coast time) we are presenting at “Weird Sh*t Investing Online” an online conference put on by Swen Lorenz of “Undervalued Shares”. BOOK at:
Weird Shit Investing Online 2026 – Undervalued Shares
Thoughts on the past year of Dynasty Trust
We haven’t discussed our portfolio approach and outcomes in a while and felt it is an appropriate juncture to do so. Examining the performance over the past twelve months – FY2026 – acknowledging that it is a short period, we are marginally disappointed.
Given the deliberate restrictions and discipline of where we invest, the two and three year numbers are more acceptable and have been created with a fraction of the volatility of many other funds and wider indices from a long only, ungeared, unhedged portfolio.
At this stage, any mild disappointment is not from major business or valuation errors within the portfolio but from omission. Not just in memory chips where Samsung Electronics (005930.KS) is within our universe of controlled companies. We attended a fabulous morning debate on the industry with back-to-back presentations 1 on Micron Technologies (MU), TSMC and ASML so we were aware of the dynamics – and the shares have risen 75% since then (late March) and 387% in US$ terms over FY2026.
Of other companies in our universe where we have real familiarity, we failed to take advantage of opportunities in businesses as diverse as:
- Alphabet +100% in FY2026;
- Hochtief, the German construction company part of Spain’s ACF +203% in FY2026;
- Madison Square Garden Sports (the teams) +92% and Entertainment (the venue) +102%; and
- Frontline PLC, the Fredriksen family-controlled shipping tanker owner +112% in FY2026.
On the flipside, however, our valuation disciplines were heavily vindicated. Many other managers with outstanding business analytical capabilities and exceptional long-term track records lost the latter attribute in Q4CY25 (Q2FY26) and Q1CY26 (Q3FY26) when the AI “wave” wreaked a precipitous share price de-rating across many service-based sectors, notably software and related platforms. The missing discipline – in our view – was an awareness of how far beyond “normal” valuations certain “outstanding” businesses had become, especially on a free cash flow yield basis. Acceptance of 2% or below FCF yields for robust but mature compounders was deemed acceptable – an effective 50year payback – and continued imputation of unrealistic double digit percentage growth rates against real, but containable, business threats. As did multiple earnings re-ratings of the same story. As long ago as February 2024, we noted the story around the core private equity businesses – all in our universe – hadn’t changed in seven years, but growth HAD progressed. Rather more progressive was the re-rating of each dollar of earnings, despite the emerging issues with private credit, which clearly presages problems within private equity, and increasingly sketchy participation in round-robin financings.
We continue to be patient with a small number of holdings where the securities trade at major discounts to intrinsic value but where board and management are executing well at both a business and capital allocation level. Put Avation PLC, Laurent Perrier and Compagnie de L’Odé in this category.
Higher levels of individual security volatility – to the benefit of our largest holding Virtu Financial – served up an opportunity to acquire an archetypal “Peter Lynch/Victor Kiam” business 2 in the latest quarter. The consensus expectation of May’s NASDAQ listing for Wise Group PLC facilitating a re-rating of the shares proved (as usual) fallacious – indeed the shares reached an eight-month high on the appointed day and promptly fell 32% in a month, to our benefit. This was partly propagated by a Belgian enquiry into the company’s systems and compliance with AML protocols. We know Wise is a business that many regulated banks would love to kill off despite a small number of them being clients to utilise its exceptional systems; we know from experience that commercial banks don’t always play clean.
Whilst the regulatory analysis might be difficult, the financial analysis is very straightforward, given Wise’ disclosures. Wise make a deliberately declining “margin” – “take rate” – on cross-border volumes which are disclosed for both business and personal customers, whilst earning interest on customer balances and paying away some of this in certain currencies, subject to regulation, back to depositors. So it’s simply: (volume estimate x take rate) + net interest margin + card fees – operating costs = profit.
With rolling twelve months to March 2026 cross-border volumes up 31.5% feeding 17.3% revenue growth and customer balances up over 36%, in our view, the company is at an advantageous point of the growth curve. The shares are currently priced at a forward P/E of 22x with 27% ROE and – subject to regulatory compliance – a competitive advantage which doesn’t appear to reflect this.
The manner in which sophisticated banks have been disintermediated across other areas of their business is instructive. In Australia, mortgage lending has migrated away from direct lending to a brokerage model relatively rapidly 3 . Allied to lesser reverence for major banking institutions by newer generations suggest the Wise Group’s of the world have a position at the centrepiece of millennial and Gen-Z finances not envisaged a few years ago.
Contribution and Portfolio positions
The major contributions to return in the latest quarter and FY2026 were as follows; the FY2026 figures in brackets are the local currency estimated equivalents. Returns are for period or to divestment:
At 30 June 2026, Dynasty Trust’s ten largest portfolio positions as a percentage of net asset value were as follows:
At quarter end, we held 22 exposures and retained 3.4% net cash weighting after all accruals.
Investing in travel – journeying to less mainstream destinations
Like the activity itself, investing in “travel” becomes significantly more difficult when the destination (investment) is less mainstream. The Amazonian jungle via Puerto Maldonado rather than the Eiffel Tower. Living in Sydney, getting to Paris is a fair effort (~23 – 28 hours) but has very established navigations; Sydney to the Peruvian jungle is rather trickier and has several different ways to arrive at this massive and beautiful mosquito farm. For Dynasty Trust, investing in “travel” through businesses with controlling owners, often necessitates far more complex analysis – versus a widely held Expedia, Hilton Worldwide or airline. The diseconomy of scale – bespoke analysis – should eventually provide a worthwhile reward, since its necessity acts as a deterrent to many other potential investors and aids in the de facto mispricing of equity.
We have direct travel exposures to four securities, all on different listing exchanges and two indirect through aviation exposures – an airport (Fairfax India Holdings, dominated by its 74% equity holding of Bengaluru International Airport) and aircraft leasing (Avation, a specialist turbo-prop lessor).
Our direct exposures, accounting for 18% of the portfolio at 30 June 2026, break into two groups:
- Hotels: HBX International (Spain) – a wholesale hotel aggregator – and EVT Limited (Australia);
- Travel retail: Avolta (Switzerland) and Lagardère (France)
The two hotel exposures have issued mild cautionary statements since the advent of the Middle East conflagration at end February 2026, with its impact on oil prices, briefly elevated jet-fuel spreads and flow-on impact to air fares. With the “ceasefire” between Iran and USA, traded Brent oil prices have now subsided. We also note the impact of the new EU biometric arrival identification procedures which represent a short-term disincentive to travel, which may be more evident in Q3CY2026.
The period since late February 2026 has shown that travel securities – in our portfolio at least – have a geo-political inverse beta – they are very weak when military activity in the Middle East steps up – partly because of the impact of numerous high traffic hub airports in the region – but quickly bounce back when the consensus feels a resolution (of sorts) is more proximate.
We find “travel” to be a very attractive thematic, but not without risk and requiring a differentiated thought process. The risks within the sector are very clear:
- Several investment avenues – hotels, airlines – are of a fixed cost nature affording large scale operating leverage, which causes difficulty when external factors – economy, politics, pandemic – dramatically slow short-term demand;
- These negative extraneous factors often have no defined time frame;
- Travel is an attractive, large and fragmented marketplace ripe for the entry of disruptive technology; and
- Numerous investment opportunities are highly regionalised and so subject to local rather than desirable global factors – hotels (again) and airports.
We have mainly (not exclusively as illustrated in this letter) tried to negate these difficulties with a focus on global businesses. These include aircraft leasing, though there are increasingly fewer listed avenues, travel retail and technology driven booking engines. Over the past few months, we have re-emphasised the exceptional long-term thematic. This thesis is simple and been discussed previously in our presentations and quarterlies. The advent of aircraft leasing in the 1970’s eventually combined with airline deregulation in the US (1970s) and Europe (1980s) to facilitate the creation of low-cost carriers. Allied to increasing wealth in developing countries, the same forces have swept across Asia and India.
Consequently, global air passengers expanded at a compound growth rate of 5.3%pa – in a virtually smooth upward line – until COVID 4 . The bounce back after COVID, in our view, is a practical example of the fact that, if possible, human beings have a strong desire to discover, interact and discover cultures other than those within which they live. A reason that totalitarian regimes remove such opportunities.
Growth in the entire travel and tourism industry is such that travel and tourism is estimated to account for around 10% of global GDP . 5 There is a strong correlation with emerging wealth and “middle class” with a steep S-curve of travel spending per head as GDP per capita moves up through the US$10,000 mark 6.
The travel eco-system is comprised of numerous two-sided markets with enormous fragmentation and potential friction costs – foreign exchange, yield optimisation mechanisms – which sit on top of industries which have fixed cost structures (airlines, hotels) and where the inability to sell capacity has demonstrably larger impacts on profitability.
Despite the obvious ability to arbitrage price, the industry continues to accommodate specialist, tailored human providers, simply because of the fragmentation and qualitative desires of the traveller. However, it’s an arena where AI and its sponsors see a greater opportunity than ever before to break into the industry. For example, there’s little doubt that AI’s use to parse together airline schedules is having an impact on the B2C component of the market. It continues to be one of the holy grails for groups such as Alphabet; what restrains them is the requirement to create the relationships with many hundreds of thousands of enterprises offering the product: hotel rooms, tours, experiences and to a lesser degree flights.
It’s a classic arena where the “AI debate” about owning the data and distribution capability versus the underlying software and technology meets head on. The industry is an obvious one – as banking was in the early 2000’s – where new technology benefits not only the creators but also the implementors and ultimately the customers.
Travel retail is a specifically neglected area within public company analysis due to the absence of listed exposures, the closely held nature of the ones which are available and the complexity of accounting within the industry. That’s despite the benefits of AI adoption due to the data analysis which increasingly underpins the industry. Travel retailers operating in the cross-border space have additional data points (passport, nationality, flight patterns) with which to hone their offerings.
Outside of airlines, investors have tended to focus on two larger groupings of companies due to their size, high returns on capital and global proliferation:
- hotel management, franchise and brand companies – Marriott, Hilton, IHG and Hyatt; and
- booking engines – Expedia and Booking Holdings
These investments represent economies of scale for the analyst; the analytical diseconomies of scale largely arise from accounting complexity. These diseconomies mean that few sell side analysts – and their firms – find it commercially worth the effort to closely follow Avolta and Lagardère other than for “intelligence” and information purposes, especially if they are listed on non-US exchanges. That is to our benefit.
In our view, there are seven thematic areas of accounting which dissuade investors from participating in the broad non-airline travel sector:
- IFRS16 (lease accounting) being a particular menace in travel retail with numerous types of leases – conventional, revenue share and co-venture rendering the use of EBITDA and EV/EBITDA metrics utterly useless ;
- “profit” and cash flow are extremely divergent even in basic business models, with the requirements for deposits and up-front payments – especially through booking engines and other agency arrangements – leading to large scale deferred revenues carried as liabilities against what appear to be unrestricted cash assets, thereby understating the magnitude of real debt within a business;
- major seasonality, depending on the location of the business and its service sector – cash flows unavoidably swing wildly from half (quarter) to half (quarter);
- the natural use of joint ventures and associates given the global nature of major players but their need for local “on the ground” know-how – this is especially prevalent in the two major travel retail exposures and gives rise to meaningful minority interests which have a genuine cash as well as accounting impact;
- “travel” is often part of a wider conglomerate structure necessitating “sum of the parts” arithmetic with which many analysts remain uncomfortable;
- as a subset of the point above, the extensive use of “ agent versus principal ” exposures which have far different return on capital profiles, especially in the hotel industry and have difficult “double counting” aspects; and
- as a result of all of the above, finding screening type tools which negate these issues is difficult.
One of our only two Australian exposures came available at an attractive entry point for many of these accounting difficulties as well as a strategy which was heavily disrupted by the second and third-level effects of COVID. The shares of EVT Limited which we discuss in detail below, are trading at the same price as they were eleven years ago. Proving up a useful valuation guide to the company is extremely difficult despite reasonable disclosure – there are some areas which could be improved – which can be usefully adapted. Issues such as ensuring a lack of double counting between property values and operations, especially in hotels and to a degree in the entertainment arena. EVT encapsulates so many of the investing deterrents inherent in “travel” especially where the motivation to dig deeply is dulled by the fact the Chair controls ~42.5% of the issued shares and EVT has a sizeable group of loyal individual and institutional shareholders disinclined to sell. The attractive “travel” story is hidden away underneath a property portfolio and cinema exhibition business. Would EVT ever contemplate a split, or is it too late? To assess the company, we deal firstly with the history – an essential to understand the two phases of asset accumulation – composition of value and potential end-game then providing the evidence on the “treasure trove” Sydney CBD property portfolio, the hotel ownership and management business (our key reason for investing), cinema interests and ski resort.
EVT Limited: Enduring assets with no known dynasty
(All figures in this assessment of EVT are in A$; no assessment of tax liability on any asset sale is undertaken due to the historic nature of many assets)
EVT is the antithesis of a US activist capital management story. No patience, no play. For all the intent shown by the company to move to the next “stage”, they represent another entity for whom the direct and indirect impact of COVID has pushed out the transition timeline to a degree which has frightened off many prospective investors.
EVT is a A$2.1billion entertainment and leisure business built around a series of assets accumulated in the 1930’s (cinemas and properties) and in the 1980’s and 2000’s (hotels, ski resort, more properties). The two phases reflect the period of management of the two generations of Rydge family who have controlled the group through these periods: Sir Norman Rydge who accumulated (below) cornerstone historic Sydney CBD properties and his son and current Chair, Alan Rydge – having taken over in 1980 as a 28year old upon the death of his father – presided over the 1980’s build out and ongoing development/pruning of the legacy assets and addition of neighbouring property assets in Sydney’s CBD – mirroring his personal residential property strategy. The company has long been an asset rich, conservative – but not static – business with long standing shareholders of a similar ilk.
This piece is not about assessing near term earnings trends , which can be volatile given operating leverage (hotels) and variability outside the control of the company – cinema releases and weather at the Thredbo ski resort. It is about providing a sensible guide to assessed value and how the share price discount might close.
Aside from inherent value and the puzzle of its liberation, as a enterprise, EVT appears set to be a two-generation dynasty. Mr. Rydge (aged 74 last month) and wife have no children. They are understated but highly generous philanthropists suggesting that within the next 30 years, there is a fair chance of the two family-controlled shareholding blocks benefitting desired family causes through eventual charitable donation; of course, an outright sale could not be ruled out but that would be unusual for this very private and conservative family. Their desire for privacy – including owning six blocks of property in one of Sydney’s most expensive streets 7 – means that questions regarding the ultimate “fate” of the shareholdings remain publicly unanswered. However, no course of eventual action suppresses the desire to build value.
A brief history of EVT’s origins is of assistance in understanding why recent initiatives are not an easy emotional process for the company. We don’t need to go through the twisted history of Australian cinema production, exhibition and distribution between its three contemporary players – EVT, Hoyts and Village Roadshow, but jump right back to the 1920’s and 1930’s.
EVT’s heritage traces back to 1911 and the early days of Spencers Pictures, Australasian Films and Union Theatres, and the sad story of Spencers founder, Cosens Spencer (who was born Spencer Cosens8). Between 1911 – 1913 the various exhibition and filmmaking companies9 combined – amidst no little rancour – to create “The Combine” which dominated the early days of film in Australia.
Sir Norman Rydge was born in 1900 and might be reasonably described as something of a stockmarket prodigy. He began running a hotel business at age 25 (Carlton Hotel) and founded Rydge’s Business Journal at age 28 – the same year he established and publicly listed Carlton Investments Limited, which remains EVT’s second largest shareholder entity to this day10.
In 1936, with the cinema business struggling, Rydge was appointed managing Director of the loss-making movie exhibitors, took control, merged them into Greater Union Theatres and had them making a profit before WWII. With the boom in theatres during the war, and general risk aversion to film production, Greater Union partnered with UK’s Rank Organisation (producer and exhibitor) in 1946. The assorted cinema holding companies were merged into Amalgamated Holdings in 1958 and the 50% Rank ownership of Greater Union was repurchased in 1984 for A$20million.
After Norman Rydge’s death in 1980, Alan Rydge became the youngest Chair of an Australian public company; the cinema business went through various joint ventures with its competitors either in total (Village Roadshow) or at individual sites (Hoyts).
The former Hoyts venture was unravelled in 2005 through exchanges of two cinema properties in Sydney one in Brisbane and one in Perth. The Sydney CBD venture left a peculiar situation still of relevance today. The Event cinemas span two freehold properties 505 and 525 George Street; the 505 George Street plot (formerly the Tracadero Ballroom) to be developed by public company Mirvac with Coombes Property Group has planning consent for a 507 unit residential tower – a A$1 billion development. Building has yet to commence. The EVT owned 525 George Street has planning permission for a 43 storey, 98 apartment, 285 room hotel (likely an EVT brand) building incorporating a 5-cinema complex 11 . The development was for sale as a freehold interest via CBRE with EoI closing about a year ago. As with its neighbour, building has not commenced. The freehold is rumoured to be for sale for $250m; we have included in the property portfolio, not within cinema exhibition.
(a) Valuation and control
At $12.88 (30 June pricing), EVT trades at a rough 34% discount to ascribed PRE TAX value per share of $19.42 as follows:
The Rydge family exercise control of EVT’s 162.5 million issued shares through three holdings within a small pyramid structure
- A private company, Enbear P/L owns 50.6% of the publicly listed Carlton Investments Ltd (CIN.AX) which owns 18.8% (30.79mn shares) of EVT;
- The same private company, Enbear P/L directly owns 19.8% (32.1million shares) of EVT; and
- Alan Rydge in his own name and another investment company, Alphoeb P/L directly own 5.4% of EVT (plus 10% of CIN).
Mr Rydge has been extremely guarded in relation to “succession” – both as Executive Chair but also of the controlling blocks as befitting a private individual. Any thesis postulated here is merely a thought process rather than backed by evidentiary public statement.
Subject to health, don’t rule out a “Buffett/Munger 12 ” scenario – just keep working until you locate the appropriate successor, which might be next year or in ten years. There may be some “trimming” of the portfolio – we suspect in a more favourable environment German cinema may be divested but wouldn’t rule out Australian cinema being sold given the ongoing changes in the industry. As we discuss below, the timeline on the Sydney CBD property “trove” has extended and it’s doubtful that will be divested. The hotel business is the key to value creation and Thredbo is an exceptional free cash flow generator.
The least likely scenario is a total sale of the business or break up beyond cinema because every other business logically fits together.
Whilst impertinent to consider, in the event of Mr. Rydge’s demise, we would not be surprised to see the key Enbearn P/L stakes in Carlton Investments and EVT bequeathed to a foundation with trusted lieutenants to administer the income stream of dividends, which at current rates on CIN and EVT amount to just over A$28million per annum. There is a precedent for this in notoriously non-philanthropic Australia: the healthcare titan, Paul Ramsey who died with no dependents in May 2014, left his private company Paul Ramsey Holdings to Paul Ramsey Foundation with the objective of the foundation benefitting from the dividend stream whilst maintaining the core capital holding. As with all benefactory decisions, the key sensitivities are ensuring the “trustees” are like-minded with the objectives of the donor.
Hence, our investment thesis is that there will continue to be growth in the asset value of EVT, from management initiative, that there will be some closure in discount to NAV as enhancement initiatives bear fruit, not that the company will be sold off or broken up ante mortem .
(b) Property: splitting operational versus COVID delayed “land-banking”
So many starting points for analysing EVT – positively or negatively – start from page 70 of the 30 June 2025 annual accounts – note 3.3 of “property, plant and equipment” allied to the latest slide release 13 of “$2.3billion property portfolio”
The start point becomes with 162.5million issued shares at A$12.88 (30 June 2026) and so an equity market capitalisation of $2,093million plus net debt of ~$520million 14 gives an enterprise value of $2,613million. Within this, the company’s property portfolio was valued in August 2025 at $2,361million adjusting for the acquisition of a hotel in Auckland and divestment in Geelong. So, EVT’s operations are theoretically valued at a lowly $252million.
Because it’s EVT, who are exceptionally prudent, the properties are not carried at this level, but a book value (after adjustment) of $1,244million. A small $1billion difference.
The analytical paragraph above is, of course, utter nonsense. However, it does serve to highlight the key complexities of EVT:
- Conservative accounting;
- Cloaked disclosure of this conservatism which the company has been content to perpetuate as far as it can for decades; and
- The difficulty is ascribing values for operations which rest upon the ownership of the underlying property.
We believe the property portfolio from August 2025 breaks down into the following segment with adjustments:
- “treasure trove” – Sydney CBD holdings including cinema property and hotel;
- Strategically owned key location hotel properties intrinsic to the business which could not be operated under management with an external owner;
- Thredbo ski resort properties in NSW; and
- Other, mainly German freeholds containing cinemas and retail rentals.
Our concise adjusted tabulation of the categories is as follows:
(c) Sydney CBD trove – what are the prospects?
EVT own the freehold over the entire 4,700sq.m block bounded in red on the corner of George Street and Market Street towards the southern (less prestigious) end of the Sydney CBD, opposite the iconic heritage listed QVB Building (on the LHS of the photograph with domes):
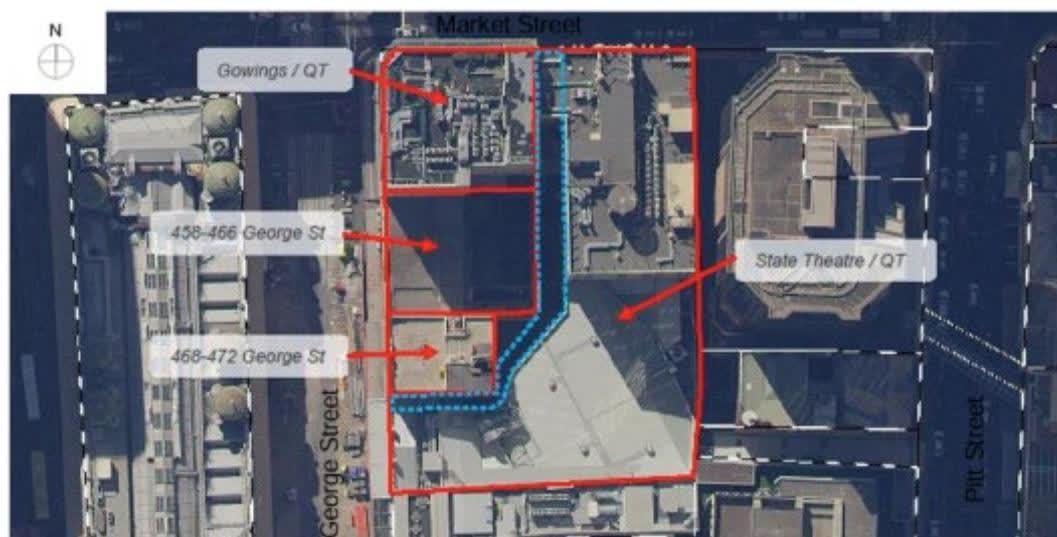
Aerial photograph of the Sydney CBD corner of George Street and Market Street. A red rectangular boundary outlines a 4,700sq.m block. Labels with arrows point to specific areas: ‘Gowings / QT’ at the top left, ‘458-466 George St’ on the left side, ‘468-472 George St’ on the left side, and ‘State Theatre / QT’ on the right side. A blue dashed line outlines a smaller area within the red boundary. A north arrow is in the top left corner.
The freehold block includes:
- State Theatre, heritage listed, built from 1926 and opened in 1929 (top right of bounded area);
- Upper floors above State Theatre;
- “Gowings Building” labelled acquired for $69million in 2006 and which together with the floors above State Theatre combines to form the QT Sydney hotel of 200 rooms + bars and restaurant;
- 458-472 George Street being two buildings (old Globe Theatre and Dudley House) bought for $116million in 2017;
- 478-480 George St (not labelled) – at bottom of red bounded area – a 16 level commercial building finished in 2015 at an estimated cost of $80million; and
- (not in photo) 525 George St, part of the Event Cinema complex, discussed in history above
EVT have continually deferred firm announcements in relation to the key 458-472 George St. contiguous site and updates on the 525 George St cinema site. We are hopeful that something more fulsome will emerge with the final FY2026 results presentation (due in the last week of August). We fully appreciate the risks involved in developments as well as the risk averse/long term culture of the company and would not be surprised if nothing concrete is announced. The good news, in context, is that our mid-point valuation of the CBD Trove is around 20% of the prevailing share price, significant but not overwhelming, despite the sentiment impost which the developments seem to possess.
Our approach to assessing the “CBD Trove” has been to remove the QT Hotel component since the Gowings Building and State Theatre effectively cannot be separated because of the hotel operating across the two buildings. We understand the creation of the hotel from office spaces in both buildings cost ~$65 million in 2013 suggesting an entry cost (excluding the historic cost of the State Theatre and the value of the retail bottom floor) to be ~$133 million. On a hotel ownership per key/room basis, the location suggests it would be at the upper end of Australian metrics (see later).
The State Theatre itself is operational and has a “collectable” value; the operations are accounted for in the “cinema” segment of EVT’s accounts but we doubt the theatre business is a meaningful profit contributor.
The overriding issues for development of the CBD Trove are obvious. Post COVID, building costs have escalated dramatically – we estimate from various sources by >50% in the past six years – and there are limited alternative uses given the unattractiveness of commercial real estate in Sydney; even residential real estate is now under a cloud with interest rate raises and changed taxation from FY2028 for investors in residential property.
In respect of 525 George Street, EVT don’t have the risk appetite to take on the build themselves at a cost well upwards of $300million 15 and no JV partners – the obvious solution – have yet emerged. Finding partners is proving difficult despite the obvious attraction of the hotel component. It’s effectively the same issue with potential developments on the other “site”.
There are numerous ways to assess the contiguous 458-480 George St. block + hotel + Theatre – a ~88metre x 53metre oblong of 4,700 sq. m opposite the QVB Building, which itself has a site area of 5,310sq.m. 16 ; included in the 4,700 sq.m. is the 478 George St commercial office building (including EVT’s head office) with a site plan of ~520sq.m. which is considered separately.
The QVB Building has transacted as recently as November 2021 as part of a deal by LinkREIT (0823.HK) acquiring 50% of three high-traffic proximate retail properties in the Sydney CBD 17 fronting George Street: QVB Building, Strand Arcade and the Galleries. Link valued the share of QVB in a manner which implies a valuation of $554million for the whole building of 14,016sq.m. gross lettable area ($39,540/sq.m.) for high end retail. By contrast, the strata based Galleries with food outlets and Japanese retail influences (Muji, Kinokuniya) transacted at an implied value of $20,000/sq.m. of GLA (14,994sq.m.).
In November 2020, EVT received development approval 18 from Sydney City Council for a 13storey 72 room hotel and retail development across the 458-472 George St buildings at a 2019 cost of $63.5million; a later office tower development plan behind the building was shelved. EVT has mooted plans, with no development application as yet, for a tower style hotel property in its place. With the increase in construction costs, based on per key metrics, a hotel may be a commercial proposition.
In respect of valuation, we view the 4160sq.m. site as being worth between cost ($116mn) or cost + the benefit of a consented DA ($178 million being $15k per sq.m.)
In respect of 478-480 George Street, we must make numerous assumptions since EVT has never disclosed tenancy details, rentals nor even gross lettable area. We are aware in the original development application of a maximum floor:space ratio of 12.2:1 and presume given the awkward looking nature of the building squeezed in adjacent to the Sydney Hilton and tiny site plan (519sq.m) that the restriction is relatively fully utilised and assume GLA of 5700sq.m.
The current environment for Sydney Southern CBD office property is very difficult. On 1 July 2026, ASX-listed Centuria Capital (CNI.AX) launched a new “contrarian” office fund with two acquisitions of 50% of buildings in the local vicinity: 680 George St (“World Square”) and 50 Goulburn St. In combination the properties have a net lettable area of 67,700sq.m. and were acquired for an imputed 100% value of $908million from Brookfield – an equivalent $13,412/sq.m. CNI believe the price paid represents 60% of replacement value. 19
If we use the CNI metrics applied to 478 George Street, it suggests the building to be worth ~$75million to $125million at replacement cost based on $13,400 – $22,350 per sq.m metrics.
Bringing all of the “CBD trove” properties together on this analysis, suggests a valuation excluding the hotel of $340m – $493m including ascribing a value of $150m – $190m to 525 George Street. This is equivalent to $2.09 – $3.03 per EVT share.
(d) Hotels
If we are less than sanguine about the near-term prospects for the undeveloped Sydney CBD “trove”, that’s not the case for hotels. In our view, the evolution of EVT’s hotel business is the key to adding further growth and value into the whole company. Our valuation assessment suggests the business is far and away the most valuable component of EVT.
The positivity arises from two sources:
- a switch to a mixed strategic ownership/asset lite strategy within the business designed to capitalise on the company’s expertise within hotel hospitality and capacity to run operations at different price points; this is enunciated in a mix of EVT’s own brands (QT, Rydges and Atura in order of price point), third parties wishing to retain their brand but operate through EVT on different managed bases, and for hotel property owners seeking a third-party brand franchise solution;
- growth in foreign tourism to Australia
Our positivity is despite the headwinds facing the Australian economy and its likely impact – together with structural forces – on internal travel operating on a fixed cost operating leveraged business. The good news is regrowth in international visitors “down under”.
In the period up to late 2019, Australia was receiving ~9.5million visitors per annum on a rolling twelve-month basis, but with annual growth having slowed from 2018 levels of ~5.5%pa down to only 2.5%.
As with numerous “long-haul” destinations in the Asia Pacific, it has taken a full six years to recover to close to pre-COVID levels. Indeed, the latest rolling twelve month numbers to April 2026, whilst exhibiting 9.6%pa growth are still only at 9.16million. We acknowledge there is greater competition than ever in the global market, partly fuelled by exchange rates (eg. Japan) or greater availability and value (eg. Vietnam). With the A$ on a trade weighted basis little changed from 2016, the country remains relatively cheap to a global traveller.
Owned properties
EVT own 20 properties with approximately 3,600 rooms at an estimated independent valuation of $1,446million or just over $400,000 per room, incorporating any ancillary space such as restaurants and bars.
Based on recent transactions in the Australasian market, tabulated below, which average $540,000 per key, this is a modest valuation:
† A$000’s
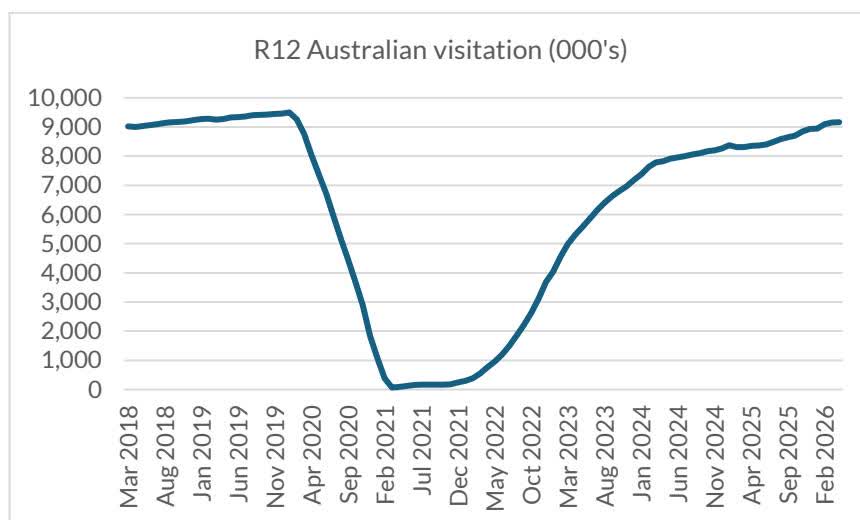
Source: Australian Bureau of Statistics: Overseas arrivals and departures
The table above shows not only EVT’s participation as buyer and seller but also that of JD Properties of Singapore. JD Props is part of the Jaleel family group of companies, founded in 1977 and establishing itself through owning and managing workforce accommodation. The family has two related property arms – JD Properties which is a property investment vehicle and High Street Holdings which has three ex-JLL hospitality team partners who founded the firm.
The Jaleel businesses and EVT have a very close relationship. We believe the family own six hotels in Australia as well as others in Singapore, Japan and Malaysia. All six Australian properties are managed by EVT either under their own brands or as part of the independent brand stable.
Looking at the acquisition record, the Jaleel’s appear to favour medium sized establishments, in niche areas with per key valuation at purchase around $300,000. This is an ideal fit for the acquisition of some hotels to be incorporated into the Pro-Vest/EVT management rights portfolio.
Managed Properties
In August 2025, EVT announced the acquisition of Pro-invest which operates hotel management agreements with third-party brands across 15 hotels and ~3200 rooms. 10 of the 15 properties are “Holiday Inn Express” franchises. The acquisition facilitated the creation of “EVT Connect Hospitality” where EVT will manage the operation of the hotel even if the owner has a franchise agreement with a third party. The acquisition price of $74million equated to $23,154 per room agreement but a rough EBITD multiple of 8.7x including synergies. It brought the number of managed rooms within EVT to ~15,800. This leaves it at #2 in Australasia ahead of IHG (~13,382 rooms) but still only a quarter of the ~65,000 of Accor.
Hotel management and franchise businesses trade at substantially different metrics to hotel owners given their far higher return on a lower capital base. This is illustrated by five major developed market franchisors on a per room or EV/EBITDA (US GAAP) basis:
† converted to US$ at 1.143; accounts estimated on US GAAP basis removing IFRS 16
The differential metrics reflect not only size which traverses multiple price points and brand offerings – size and premium clearly warrant premia as well as history. The table certainly suggests that the EVT acquisition of Pro-invest was very appropriately priced.
The overall business has shown slow but consistent growth in EBITDA after occupancy costs, despite a variety of disruptions for refurbishments, notably in Queenstown, NZ. With a full year to come of the managed business plus scope for ARR increases and hoped for decent occupancy, we expect the segment to earn ~$120million in the FY2027year.
Valuation
As with the property portfolio we adopt a more asset-based approach based on evidence of recent transactions, tabulated above. On this basis, we value the combined business at between $2,315 million and $2,808 million. This is based on a per room managed value of $23,175 – $25,000 ($366 million – $400million) and per key owned room of $540,000 – $667,000 ($1,949 million – $2,408 million).
This implies an EV/EBITDA (pre IFRS 16) multiple of around 21x FY2027 earnings.
(e) Cinema: Recent consistency despite headwinds
The bulk of value within the cinema business resides in Australia as a result of more consistent operating metrics as well as the underpinning property value of the single site at 525 George St in Sydney’s CBD.
EVT’s Event operates approximately 27% of all screens in the Australian market (600 of 2240) and some 35% of those in New Zealand (136 of ~385). Because of the make-up of the market, cinemas core component of Australian culture (shelter in summer) Event is one of few globally publicly listed such enterprises which has not undertaken a trip to bankruptcy protection and restructure. This also reflects the conservative and prudent culture which pervades EVT.
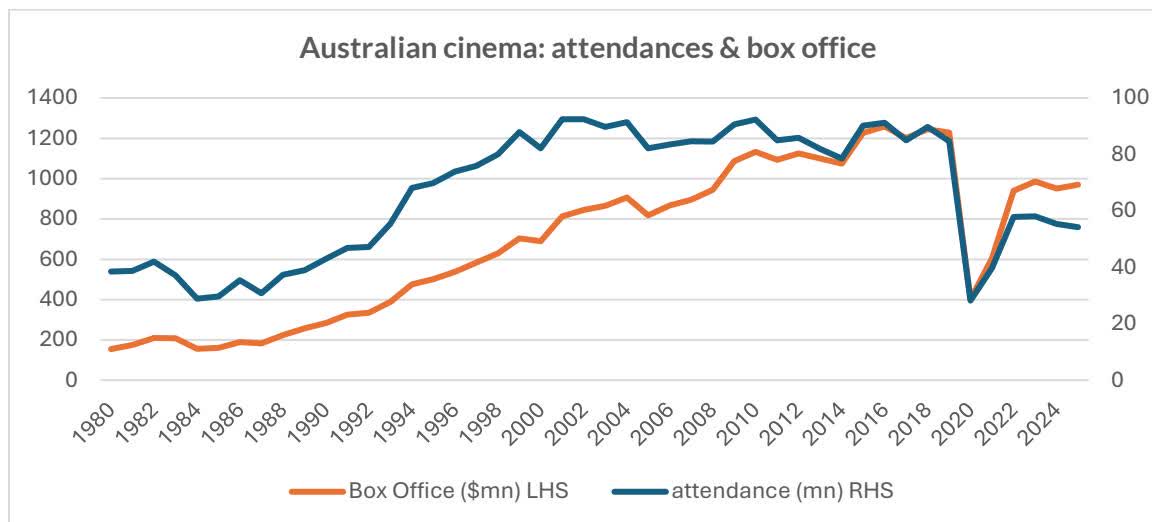
The “melting ice-cube” aspect of cinema economics has abated somewhat in the past two years after the post COVID collapse from 2019 and prior years when cinema attendances in Australia peaked in recent years at just over 90 million. Box office is yet to reach 2016 peak box-office revenue of $1.26billion
EVT’s major competitor in the Australian landscape, Hoyts Cinemas is the antithesis of EVT single controller since WWII. Established in 1909, Hoyts was sold to 20th Century Fox in 1930; Fox retained ownership until the early 1980s when it sold to an investor group, who were bought out by the Fink family in 1985. Hoyts also entered into the radio market and acquired interests in cinema chains in Mexico, Chile and USA as well as New Zealand. The death of patriarch Leon Fink in 1993 led to a sale to private equity group Hellman & Friedman and Lend Lease in 1993; the cinema circuit was IPO’d in 1995 on ASX as Hoyts Cinemas Limited (HOY).
HOY was acquired by Consolidated Press Holdings (Packer family) in 1999 at an enterprise value of $1025million 20 ; the non-ANZ assets were gradually divested and the chain sold to a JV of Publishing and Broadcasting/West Australian Newspapers. In 2007, the private equity group PEP acquired Hoyts for an enterprise value of $440million; seven years on, the business entered its Chinese ownership vortex, within the orbit of the highly acquisitive Dalian Wanda Group. The ownership has since been restructured to Ruyi Film Entertainment (f/k/a Wanda Film) a Shenzhen listed company (2739.SZ) where it resides together with 900 Chinese domestic cinema screens.
Hoyts runs some 500 screens and also owns the main cinema advertising agency, Val Morgan, but has laboured under significant debt loads over recent years; however, latest ASIC filings suggest strong cash flow and a recovery in the market post COVID have assisted in improving profitability:
In 2023, prior to the move to the current structure, media reports suggest Hoyts was made available for sale, with reputed offering price of A$1 billion, but highest bid allegedly from the prior owner PEP at A$700 million 21 (enterprise value). This suggests a valuation of ~10.5x forward EBIT and equivalent to around A$1.4 million per screen.
How do the economics of cinema exhibition work?
In very broad terms, the proportional economics of cinema exhibition haven’t changed that much over the last twenty or so years (they have in production), merely the top line revenues which reached a peak in the mid 2010-2020 period and have since declined. Cinema has always been about getting attendances not to watch moves – but to sell them popcorn, ice cream and soft drinks and more recently, wine. That’s because the exhibitor keeps 100% of the (high margin) revenue from those sales rather than the film box office.
Box office is split between exhibitor and distributor – the renter of the film. One real change over recent years has been the front loading of the distribution split which reflects the increased relevance of “franchise” type films: Marvel – Avengers, Spider-Man, Star Wars, James Bond etc. The front loading means that in the first weeks (high attendance) of a films run, the distributor may take 70% of box office, declining to 30% or so after week 3 -4. Moreover, with an increased number of high quality re-broadcast streaming outlets, the (Exclusive) theatrical windows have tended to be shorter.
It is essential for the producer to have strong early release numbers given that they garner a fixed percentage of the distributor’s revenue, after expenses for film prints and distributor advertising. Over a full run, for a moderately successful (non-franchise) film, the gross box office split tends towards a 50-10-40 exhibitor, distributor, producer split. The production split can (of course) be broken down further with “talent” often foregoing full remuneration in exchange for revenue splits.
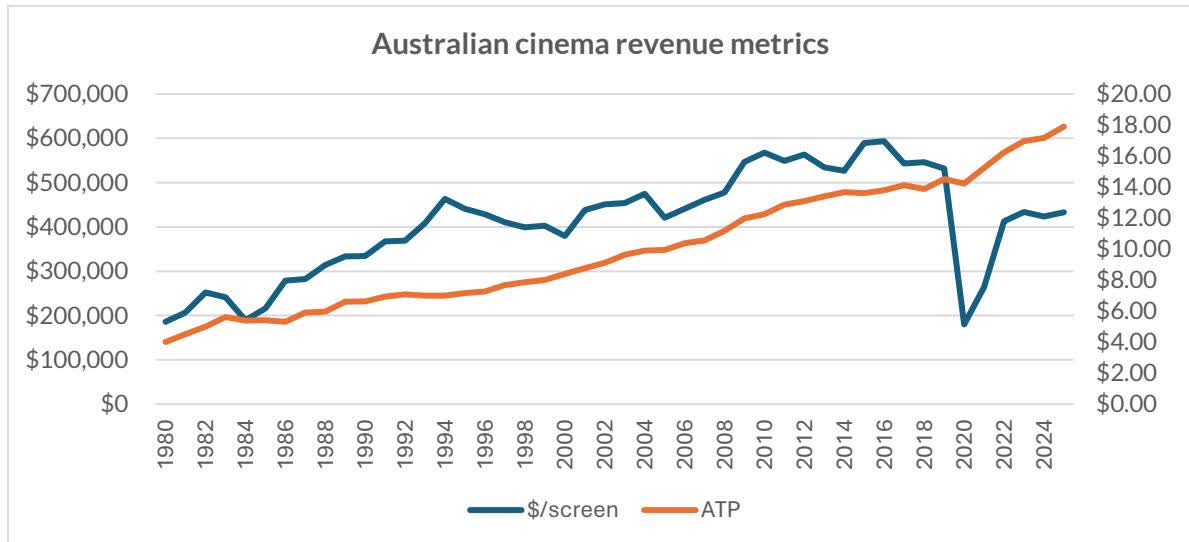
Hence, over the medium term the competitive pressures on exhibitors from alternative viewing, lesser runs and greater distributor cuts on franchises are unlikely to abate. The cinema response has continued to be ‘premiumisation’ of enhancing the experience, not just through technology but cinema comfort and concessions. The effectiveness of such measures in an economic downturn is likely to be lessened; historically, cinema has operated akin to a “lipstick effect” of cost-effective entertainment outside the house for financially and emotionally stressed consumers – check the 1990-92 metrics in the charts above.
What might Event Australian cinema business be worth?
Valuations of cinema exhibition businesses need to be assessed in the context of single periods benefitting from “blockbuster” style releases which benefit earnings but are often not repeatable. We prefer to smooth cinematic earnings over periods to derive an average profit base worthy of capitalisation. Event cinemas historic segmental results – including the George St cinema with 16 screens – are tabulated below:
There are a limited number of global exhibition companies in developed markets which have not recently encountered financial distress and carry massive debt versus equity loads.
The average metrics above show some reasonable consistency with the offer for Hoyts in 2023: 12.3x forward EBIT (HOY 10.5) and A$1.12mn/screen (HOY A$1.4mn). Based on our crude adjustments to Event to evaluate 525 George Street, Sydney as a lease and ascribing an 11.5x EBIT multiple to forward earnings, we derive a low valuation of A$450million for the cinema operations; in a sale we view a per screen valuation as more useful suggesting a value of ~$670million. This lines up more closely with the mooted PEP offer for Hoyts.
We assume the State Theatre whose operating metrics are included in the ‘cinema’ results is only marginally profitable (if at all) and include its strategic value as an anchoring – though heritage listed – component of the Sydney CBD “land bank”.
Cinema Germany
EVT bought into the German exhibition market through a joint venture with Kieft & Kieft aiming to operate 30 multiplexes in Germany but also with Middle East aspirations. In December 2023, EVT acquired the residual 50% of Kieft & Kieft – operator of the Cinestar circuit – with earnings having declined to approximately breakeven. The acquisition took place after an abortive 2018-2020 sale process involving Vue International – now part of the Barings/Farallon stable (and another restructured cinema chain) fell over. The initial bid valued Cinemark at €220 million, including deferred consideration, with €130 million up front.
The German business has rebounded strongly in H1FY26 on the back of strong local product, but over the preceding two years has not been profitable as a cinema operation. Income has effectively come from the ownership of four properties – 31 screens and related retail or hotel space – which were valued at $68million in the EVT property “book” in August 2025 22 – an effective yield of 7.3%, given the locations in Mainz, Dusseldorf, Stade and Neumunster.
Adjusting cinema earnings for an effective rental if the properties were sold 23 suggests the business to be worth ~A$60million at around 8x EBIT to give a total valuation around A$128million including property. There could reasonably be A$10-15million of upside from yield compression.
(f) Thredbo
Thredbo is some six hours by car just under 500km southwest of Sydney in the Kosciuszko National Park, relatively close to the Victorian border. In the mid 1950’s, a syndicate of ex-pat Europeans working in the nearby Snowy Mountains saw the potential for skiing in the area and were granted a head-lease by the NSW Government with the proviso they build a chair lift and hotel. Needing a partner, they attracted fellow European Dick Dusseldorp, the founder of LendLease Corporation who eventually acquired the lease in 1961. Lend Lease (LLC.AX) developed the resort but in 1987 sold the asset to EVT for $18million.
Thredbo is especially valuable since EVT hold the 957-hectare head lease until 2057 and operate all the infrastructure as well as the obvious assets such as chairlifts and the Horizons Lake Jindabyne Hotel. All other accommodation, restaurants, shops are either run by EVT or pay rental to EVT.
EVT have made significant long-term investments in new ski-runs increasing the number to 50, new lifts now up to 10, and snow making machinery and have also made inroads into attracting summer visitors, especially for walkers and mountain bikers with specific courses. Despite this, Thredbo is still heavily oriented to winter as the following abbreviated table illustrates:
Thredbo’s revenue and profitability is highly variable from year-to-year dependent upon weather in the July-December Southern Hemisphere winter. Averaging the past five full years and making an estimate for the recent H2 2026 and acknowledging Government COVID assistance in 2021, we believe Thredbo has maintainable EBITDA margins in the order of 27%. Capital expenditure has been lumpy varying from $17-$18 million per annum when significant new equipment is installed down to FY2025’s $9.3million.
Our approach to a base valuation given the relatively simple cash flows is to use a Gordon Growth model DCF starting with maintainable EBITDA of $23.6 million with growth rate of 5% in EBITDA, 4% in capex, discounted back at 11%. This provides a free cash flow valuation of $199 million; this compares with book value of assets in the segmental accounts of $113 million.
Our higher valuation comes from the property slide presentation of August 202524 which values Regional NSW property at $311 million; by eliminating the only other asset (Atura Hotel, Albury) we believe the independent value of Thredbo is $281 million. Moreover, the book value of Regional NSW assets is ascribed at $105 million which has a degree of consistency with the segmental disclosures.
1 25 March 2026, “Fat Alpha Asia” Ho Chi Minh City
2 I love the product so I bought the shares/company (with proper valuation and analytical diligence)
4 Source: World Bank & International Civil Aviation Organisation. ICAO numbers vary from Airports Council International pax numbers since they are based on carrier registration numbers not ACI airport transit figures which counts connecting passengers twice
5 HBX Group International Prospectus c/- World Travel and Tourism Council January 2025
6 HBX Group International Prospectus c/- Oxford Economics January 2025
7 Wunulla Road, Point Piper
8 Cosens lost control of Spencers whilst overseas, emigrated back to Canada, shot his ranch foreman in 1930 and drowned immediately thereafter in a river.
9 Wests Limited, Amalgamated Pictures to create Australasian Films, Union Theatres, Spencers Pictures and then J D Williams AmusementCo.
10 Carlton’s own controller Enbee Pty Limited is the largest (NBR = Norman Bede Rydge)
11 CBRE marketing video at – YouTube
12 Our favourite news article of the past twelve months is “The Untold Story of Charlie Munger’s Final Years” by Gregory Zimmerman in Wall St Journal 26 November 2025
13 ASX release 25 August 2025; there is a small difference between the slide deck and annual report where the former shows $1,244 million of properties versus Note 3.3 showing $1,184 million book value “worth” $2,180million
14 ASX announcement of refinancing 25 March 2026
15 The development application D/2022/481 in May 2023 cited A$225 million cost of works
16 QVB ‘Highest and Best Use Analysis “ City of Sydney August 2019
17 7 Nov 2021 “Link acquires Prime iconic retail properties in Sydney, Australia” LinkREIT Press release and presentation
18 D/2109/883
19 ASX Announcement “Centuria launches $454 million Sydney CBD Prime Office Fund” 1 July 2026
20 Funds headed by the author at the time in his role at Rothschild Australia Asset Management owned 6.2% of the company immediately prior to acquisition; equity value at acquisition A$625 million, net debt A$400million
21 “Hoyts suitor PEP lines up debt funding for $700m bid” Australian Financial Review 31 July 2023
22 EVT ASX Announcement “Property Portfolio” 25 August 2025
23 Remove rental income and impute lease rent for cinemas
24ASX release “$2.3 billion property portfolio” 25 August 2025
Editor’s Note: The summary bullets for this article were chosen by Seeking Alpha editors.