
Here’s what the data related to the Ethereum futures market suggests regarding whether the sentiment around ETH is looking bearish or bullish.
Ethereum Taker Buy Sell Ratio Has Observed A Strong Surge Recently
In a new CryptoQuant Quicktake post, an analyst has talked about the outlook of Ethereum based on futures market data. The focus indicator here is the “Taker Buy Sell Ratio,” which keeps track of the ETH taker buy and taker sell volumes on the derivatives platforms.
When the value of this metric is greater than 1, it means the taker’s buy or long volume outweighs the taker’s sell or short volume and thus, a majority bullish sentiment is present in the market.
On the other hand, the indicator being under the mark implies the dominance of a bearish mentality among future users as more sellers are willing to sell at a lower price.
Now, here is a chart that shows the trend in the 14-day simple moving average (SMA) Ethereum Taker Buy Sell Ratio over the last few months:

The 14-day SMA value of the metric appears to have been sharply going up in recent days | Source: CryptoQuant
As is visible in the above graph, the 14-day SMA Ethereum Taker Buy Sell Ratio has observed a rapid increase recently, implying that the balance in the market has been shifting.
Alongside this spike in the indicator, the asset’s price has also seen a surge. The chart shows that a similar trend in the metric was also observed in the lead-up to the price rally in the first quarter of the year.
Based on the recent trend, the quant comments:
This surge indicates strong buying interest in the perpetual market, suggesting a notable bullish sentiment. If this upward trend in the Taker Buy/Sell Ratio continues, it confirms a potential mid-term bullish trend in the market, with the price likely rallying toward higher values.
It remains to be seen if the 14-day SMA Taker Buy Sell Ratio will continue its surge in the coming days, thus confirming this possible bullish setup for the cryptocurrency.
Speaking of the futures market, the CME Group has recently seen its dominance grow in the calendar futures market for Ethereum and Bitcoin, as the analytics firm Glassnode pointed out in an X post.
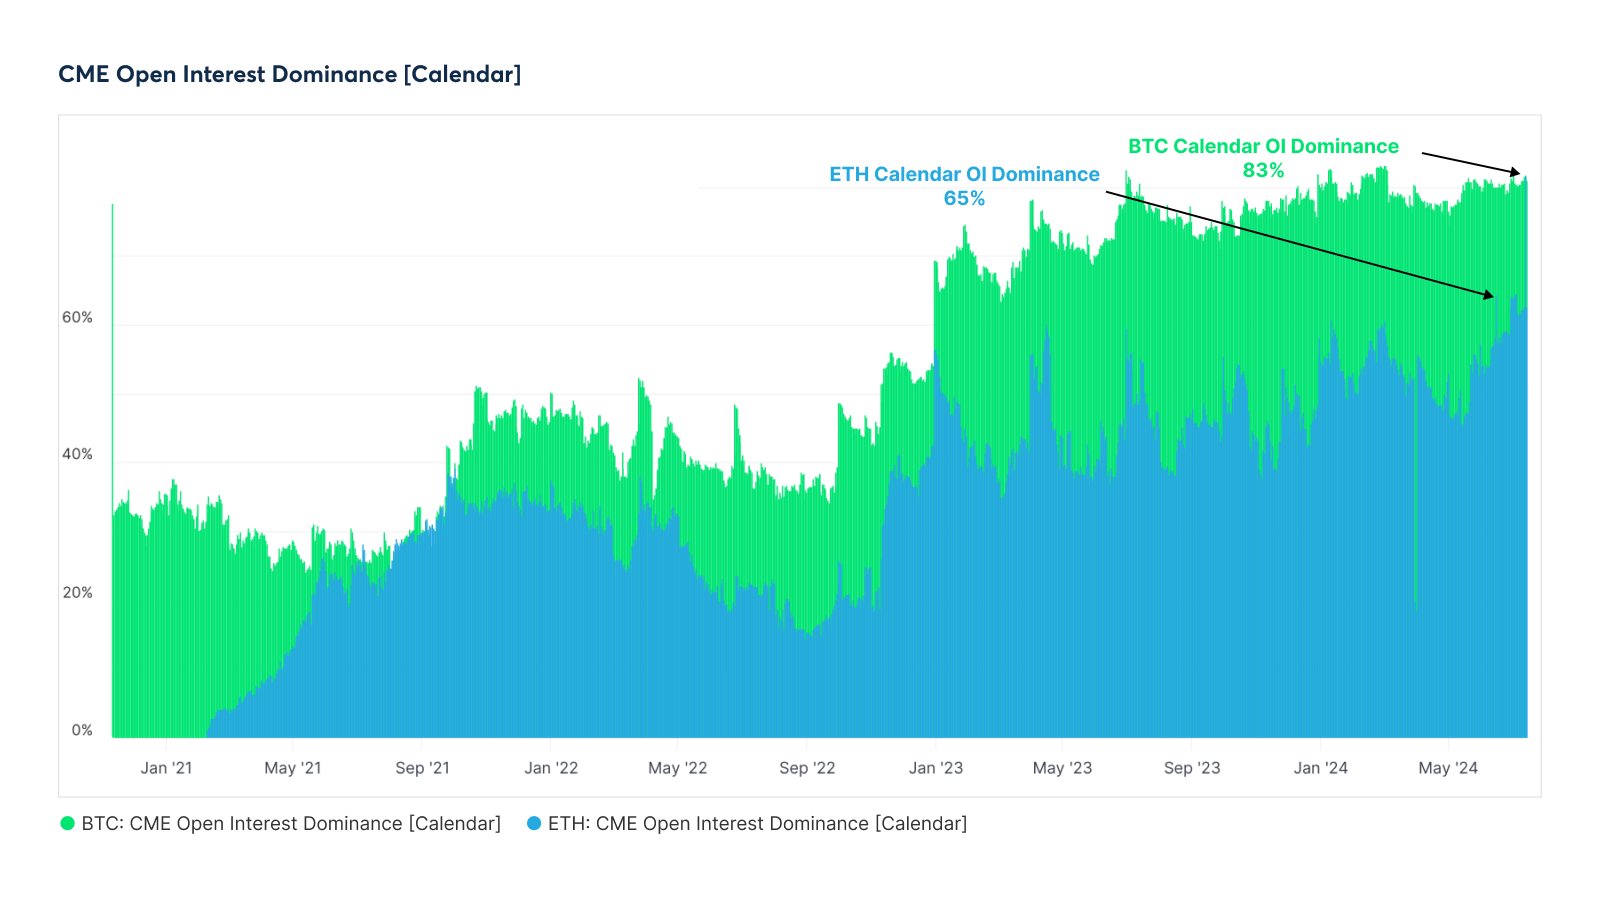
The trend in the Open Interest dominance of the CME group in the BTC and ETH calendar futures market | Source: Glassnode on X
The above chart displays the data for the Open Interest dominance of the CME Group. The Open Interest refers to the number of contracts currently open on the calendar futures market.
It would appear that the CME Group now occupies 83% and 65% of the Bitcoin and Ethereum calendar Open Interests, respectively.
ETH Price
Ethereum’s recovery has stalled during the last few days as the asset’s price still trades around the $3,400 mark.
Looks like the price of the coin has been moving sideways since its surge | Source: ETHUSD on TradingView
Featured image from Dall-E, CryptoQuant.com Glassnode.com, chart from TradingView.com