cagkansayin/iStock via Getty Images
I have a riddle for you.
Total employment is near an all-time high. Wages are rising faster than inflation. Retail sales remain robust. Airline travel is reaching record levels and expected to go even higher this summer. The stock market is within a few percentage points of all-time highs.
It was the best of times…
And yet, consumers are dour about the economy.
Most people think the US economy is currently in recession. About half of the population also believes that unemployment is at a 50-year high and that the stock market is down this year. (The opposite is true in both cases).
That’s according to a recent Harris Poll commissioned by The Guardian. The key finding of this poll is that 56% of Americans think the economy is in recession right now.
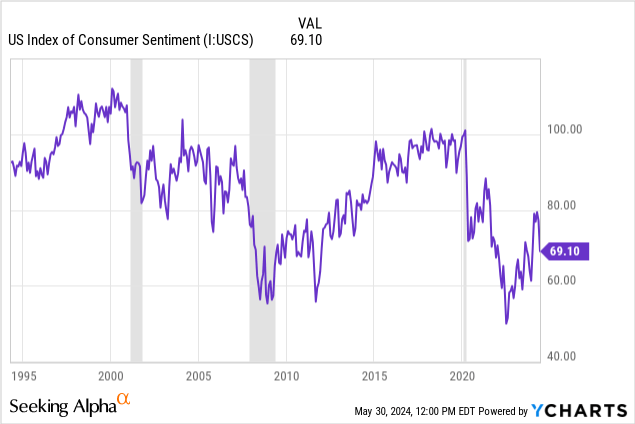
The University of Michigan consumer sentiment index likewise shows a recent plunge back toward recessionary levels.
…it was the worst of times(?)
How can these two facts both be true?
How can the economy be so conspicuously strong and yet consumers so unshakeably morose about it?
I find most media pundits’ answer to this riddle remarkably un-nuanced and sometimes exasperated, as if what they really want to say is, “Why can’t consumers just wake up and realize this is a strong economy?”
Well, if you’ve ever tried to help someone sad by simply telling them to “cheer up,” you probably know how effective this tactic is.
But you and me, dear reader, we aren’t afraid of a little nuance. We know the answer to the riddle.
The riddle is, “Is this a good economy or a bad economy?” And the answer is:
Yes.
Let’s look at some charts.
(By the way, I still want to cover the third of three macro headwinds to economic growth — aging demographics and a falling birth rate — but that will have to wait for a future week.)
Afterward, I’ll cover all the dividend stocks on my buy list going into June.
Why Consumers Hate This Economy
On the surface, it’s hard not to conclude that the economy is strong.
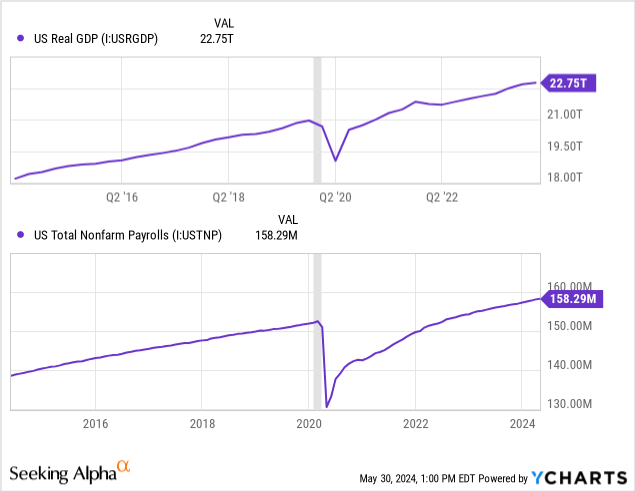
Real (inflation-adjusted) GDP growth is back to its pre-COVID growth trend line, and total employment, while lower than if the pre-COVID trend had continued, is some 6 million jobs greater than immediately preceding the pandemic.
On the business side of the economy, aside from a few weak areas, things are looking pretty resilient. Large corporate earnings growth is re-accelerating (admittedly driven by a relatively small number of companies), and capex has held up.
Torsten Slok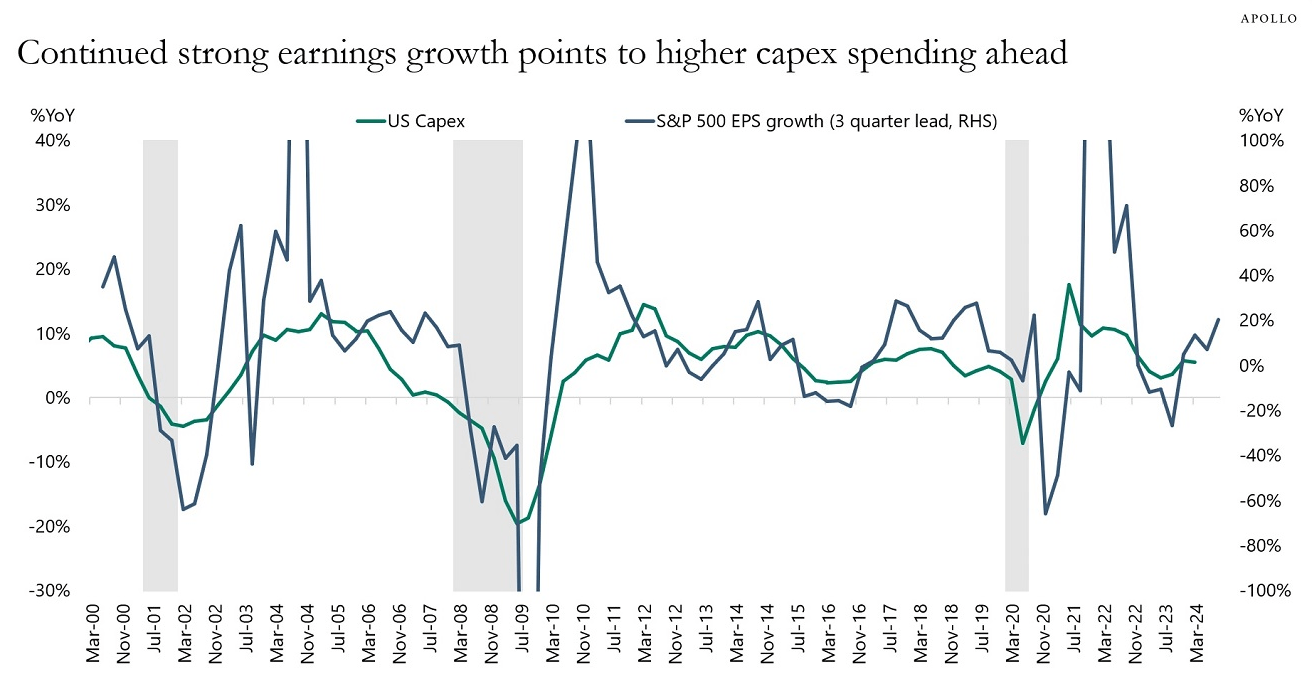
A downward slide of capex is usually a portent of oncoming recession, so the lack of such a slide seems to bode well for earnings and GDP growth.
Likewise, consumers continue to spend. Personal consumption expenditures continue to grow rapidly on both goods and services. People are also traveling and vacationing more, not less.
Goldman Sachs via Mike Zaccardi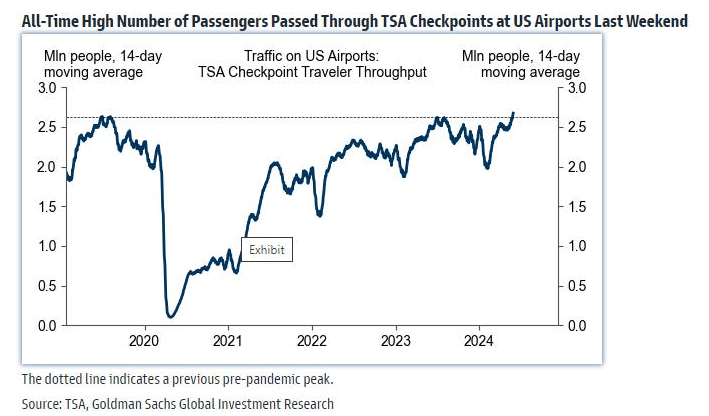
Moreover, while inflation outpaced wage growth for a while, that situation has since reversed and now wages are growing slightly faster than inflation.
Since February 2020, US average hourly earnings have risen slightly more than the CPI.
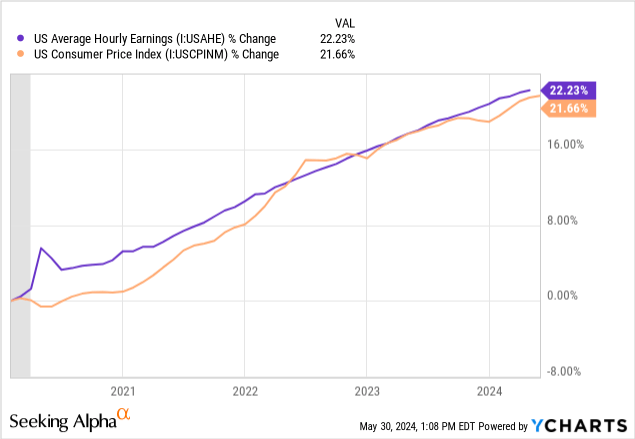
Inflation plays tricks on the mind. Almost all prices have gone up, but many goods prices have risen less than wages. These goods are far less visible than those that have risen much more than wages. They’re practically invisible compared to the most rapidly rising prices today, such as car insurance.
Here’s another point the data clearly shows but is hard to accept: wage growth has been highest for the lowest-income workers since COVID-19 began.
BofA Global Research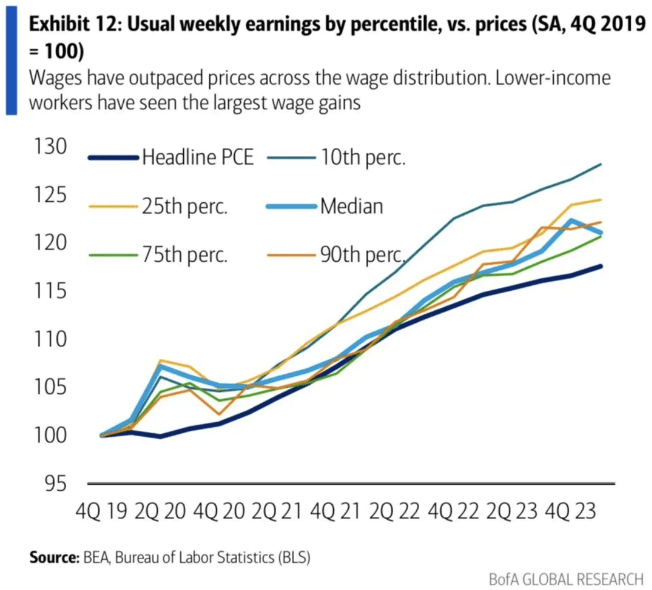
Again, when you look at soaring credit card debt, auto debt, and delinquency rates (mostly driven by the lower half of the income spectrum), these numbers don’t readily ring true.
The natural question that enters my mind is whether we are measuring inflation properly.
I hesitate to even bring up this question, because every time I come across someone saying that the CPI/PCE are understating true price increases, (1) they insist that this understatement is not by a little but by a lot, and (2) they always (without fail) are either trying to convince me to buy gold/bitcoin or motivated by a political ideology.
I’m not saying gold or bitcoin are worthless, nor am I saying that being ideological is inherently a bad thing. I am just skeptical of any macroeconomic thesis that ends in “and that’s why you should buy gold/bitcoin” or “and that’s why my ideological commitments are correct.”
With that said, I do wonder if inflation is in some areas being understated by the government’s metrics.
(Not in all areas, by the way. I’ve written many times about how the BLS’s shelter inflation metrics lag real-time changes in residential rent rates by about a year. This contributed to understated inflation in 2021, when everybody except the CPI could see that rents were soaring. And now it is contributing to overstated inflation, creating a huge gap between the CPI and CPI ex shelter.
St. Louis Fed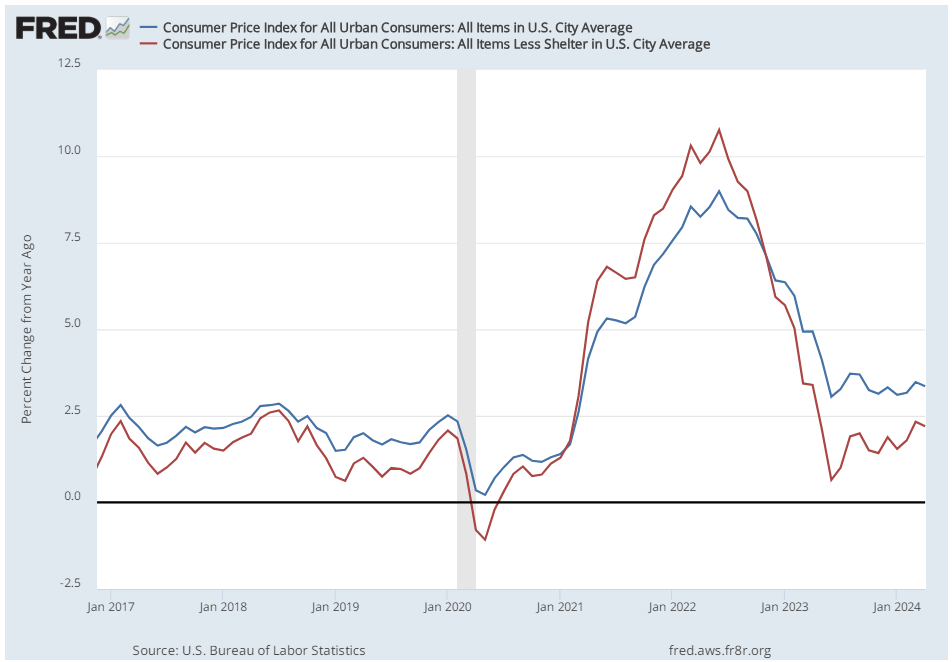
The private sector index Truflation also shows consumer inflation well below the CPI and PCE.
Back in the 1990s, the Senate Finance Committee commissioned a study on the CPI that concluded it was overstating actual inflation by about one point. So the way they calculated the CPI was modified to bring it down in line with true price increases.
Today, I wonder if the situation has reversed. I wonder whether most consumers’ actual experience of inflation is being understated by the government’s metrics.
As Vahan Roth discussed in a recent article for GIS, maybe the weights assigned to the items in the CPI don’t actually reflect how consumers are spending money. And maybe hedonic adjustments, which are inherently subjective calculations of the monetary value of quality improvements in products, aren’t quite right.
The reason I wonder this is that there are real signs of strain in the ranks of many consumers, especially those living paycheck-to-paycheck.
Of course, in our highly politically polarized society, it isn’t surprising that sentiment varies depending on one’s political views. Two-thirds of Republicans believe the US is in recession while only a little less than half of Democrats believe so.
The Guardian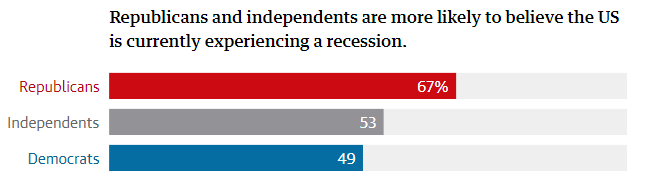
That’s a double-edged sword, though. Maybe Republicans believe the economy is worse than it is because Biden is in the White House, but maybe Democrats believe the economy is better than it is for the same reason.
There is a political element to this, but this sentiment indicator isn’t purely about politics. After all, slightly over half of independents and almost half of Democrats also think we are in recession.
Unlike many media pundits, I do not think consumer pessimism about the economy is purely psychological.
In last week’s article, I mentioned that real retail & restaurant sales have been slightly negative over the last few years. In other words, retailers and restaurants are selling fewer units of stuff but at higher prices.
If you zoom out to a long timeframe, you’ll notice that the only times real retail & food service sales are flat or negative is during recessions (indicated by the vertical gray bars).
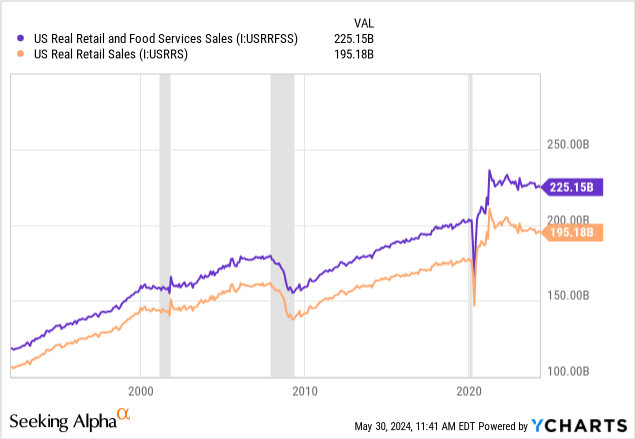
A traditionally “strong economy” features robust growth in real retail & restaurant sales. In other words, during your typical economic expansion, retailers and restaurants are selling a larger and larger volume of items. They aren’t merely being sustained by higher and higher prices.
This dip is a bit clearer when we look at real retail & food services sales per capita over a trailing twelve month period:
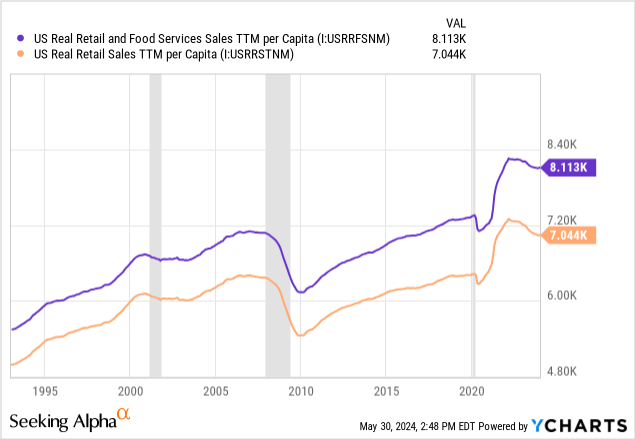
This dip may not be major, especially for food services, but it is a dip. And dips like these almost always coincide with recessions.
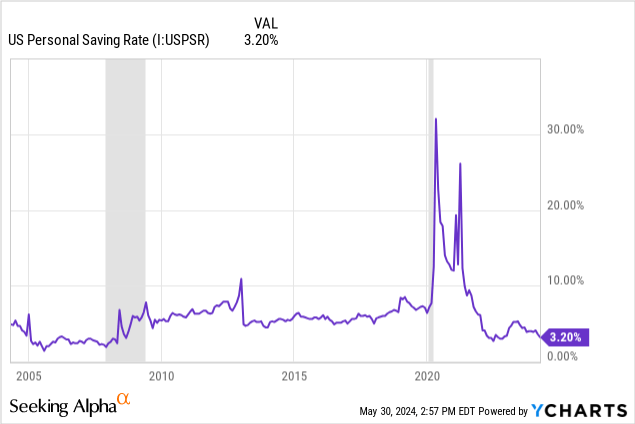
Now, if consumers were buying fewer goods and restaurant menu items merely as a protest against higher prices (rather than a shortage of spending power), then we would see the savings rate rise. We’d probably also see credit card debt hold steady. We’d see debt delinquency rates hold steady or fall.
But that isn’t what we’re seeing.
The personal saving rate is near its lowest level in decades, meaning that consumers are collectively spending almost every dollar they make.
And many consumers are spending a lot more than what they make, as evidenced by the sharp surge in credit card debt over the last few years.
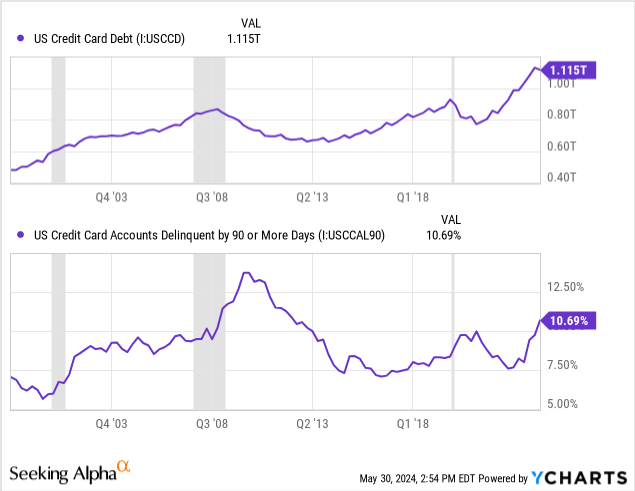
It’s true that credit card debt pulled back a bit in Q1, following its seasonal pattern. Consumers run up balances around the holidays and then partially pay them down in the early months of the following year. The overall trajectory of credit card debt, though, remains upward.
Delinquencies, too, appear to be in a cyclical upswing. Usually when credit card delinquencies are rising this fast, the economy is in recession.
A similar story is playing out in the auto loan space. Over the last five years, auto loan debt has risen almost exactly as much as the average price of new and used cars.
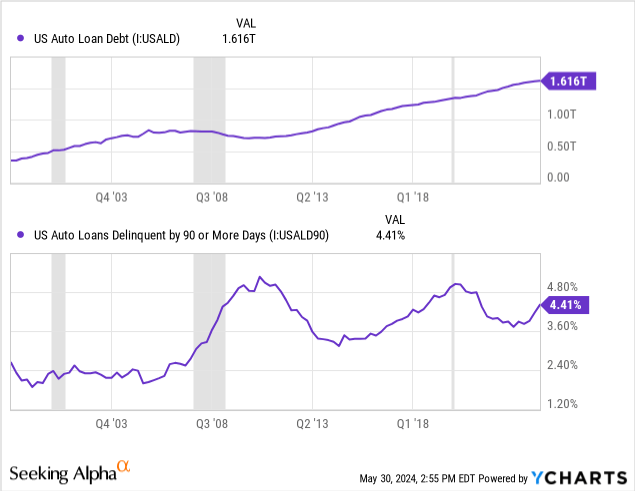
On its own, the amount of growth in auto loan debt isn’t that striking. But combine it with the increase in interest rates, and the resulting rise in car payments has led to an upswing in delinquencies.
Again, when delinquencies are rising like they are today, the economy is usually in either recession or the late stages of the economic cycle.
Here’s one more point to consider in answering our riddle: GDP is being propped up by high government spending.
US government mandatory spending is about one percentage point of GDP higher today than before COVID-19, and it is expected to trend higher over the remainder of the decade.
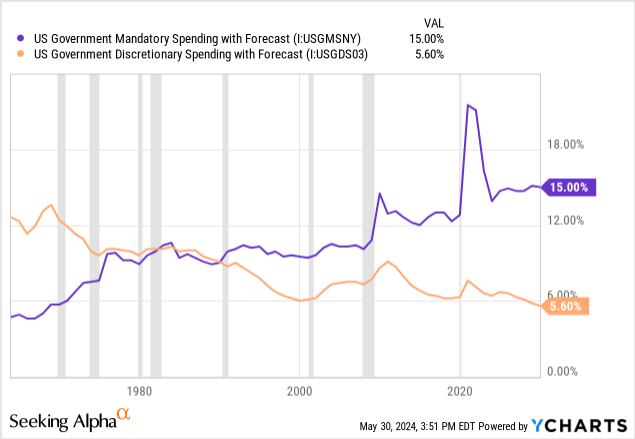
Meanwhile, this chart also demonstrates a problem with letting out-of-control mandatory spending go unchecked: it crowds out discretionary spending’s share of economic output.
As I explained in “The Fiscal Death Spiral Has No End In Sight,” discretionary spending tends to have a much higher fiscal multiplier than mandatory spending. In other words, the various types of discretionary spending tend to generate higher GDP returns on investment than mandatory spending.
Government spending, then, appears to be artificially inflating GDP growth numbers and therefore making the economy look a little stronger than it really is.
In short, today’s economy is the duckbilled platypus of economies. It’s hard to characterize. The picture is mixed and nuanced. The economy is surprisingly resilient, yet undeniably fragile under the surface.
My Buy List Going Into June
My buy list has gotten pretty long with the recent “Fed hawkishness” panic selloff. But most of the names on here are the same as last week, so I’ll highlight the new names I’ve added to the buy list in bold.
| Dividend Yield | 5-Year Div Growth Rate | |
| Agree Realty (ADC) | 5.0% | 6% |
| American Homes 4 Rent (AMH) | 2.9% | 34% |
| American Tower (AMT) | 3.4% | 15% |
| Alexandria Real Estate Equities (ARE) | 4.4% | 6% |
| Bar Harbor Bankshares (BHB) | 4.6% | 7% |
| Cullen/Frost Bankers (CFR) | 3.6% | 7% |
| Comcast (CMCSA) | 3.2% | 9% |
| EastGroup Properties (EGP) | 3.2% | 13% |
| InvenTrust Properties (IVT) | 3.7% | 4% |
| Mid-America Apartment Communities (MAA) | 4.5% | 9% |
| Rexford Industrial (REXR) | 3.7% | 19% |
| Toronto-Dominion Bank (TD) | 5.4% | 8% |
| VICI Properties (VICI) | 5.9% | 10% |
| Essential Utilities (WTRG) | 3.4% | 7% |
Note #1: I don’t have the funds to buy each of these in bulk, so I’ll either buy one or two shares of each or choose where to allocate based on the given prices of the day.
Note #2: Some of these dividend growth rates from the last five highly favorable years obviously aren’t repeatable over the next five years. For example, AMH, AMT, EGP, and REXR are more likely to produce high single-digit or low double-digit dividend growth rates. MAA, TD, and VICI are more likely to turn in mid-single-digit dividend growth. I think the other companies’ dividend growth rates are in the ballpark of where they could be in the next five years, though.
Since I gave pitches for the non-highlighted names last week, I’ll focus this week on the new, highlighted names.
I do want to share charts relevant to ARE and IVT, though.
Alexandria Real Estate
First, recall that Alexandria owns and develops state-of-the-art life science research facilities in the most productive R&D clusters in the nation. My argument has been that the sheer quality of its properties along with its long-established reputation as an industry leader gives it a competitive advantage that insulates it somewhat from new supply.
Biotech tenants are more interested in a good location and facility than a good price.
Even so, at least some new supply competes with ARE’s portfolio. And the sheer amount of new supply hitting the market right now has been enough to dent ARE’s leasing volume and rent growth.
JLL Research Life Science Report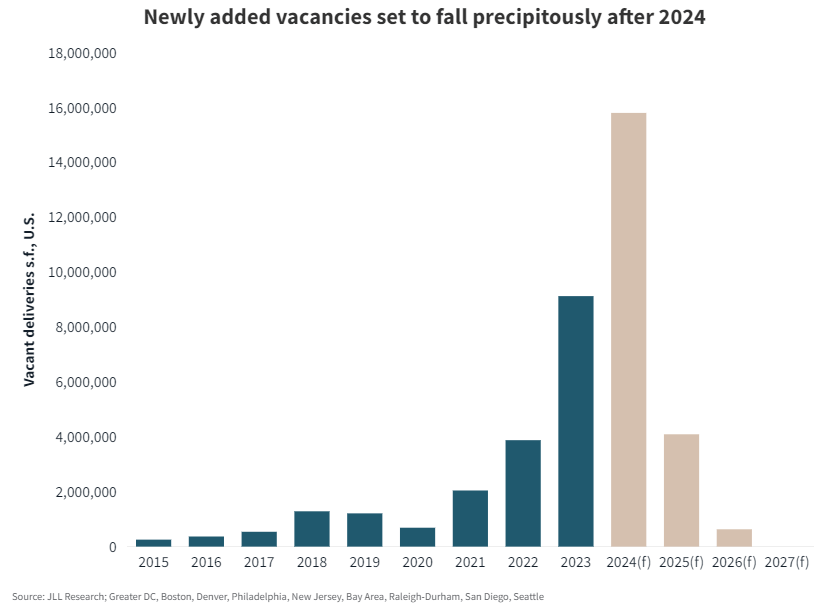
Much of this new life science space is vanilla shell, capable of being used as lab space or 100% traditional office. This contrasts with ARE’s highly specialized buildings.
But enough of this new space is capable diluting tenant demand as to act as a headwind for ARE’s organic growth for at least the next year or so.
Fortunately for me, my time horizon is a lot longer than a year or so.
In a world virtually assured to spend more money on healthcare in the coming decades, ARE’s top-tier research facilities should only grow more valuable.
InvenTrust Properties
Second, concerning InvenTrust, the retail real estate is finally getting its time in the sun, and that is especially the case for the Sunbelt.
Consider two factors, one on the supply side and another on the demand side.
On the supply side, there simply has been very little since the Great Financial Crisis. The country had an oversupply of retail space for a long time, which forced landlords to invest heavily in their centers in order to attract tenants and increase occupancy.
JLL Research Q1 2024 Retail Outlook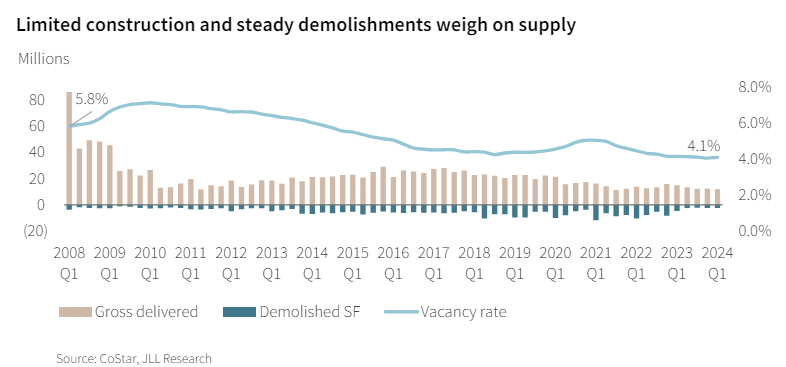
But today, occupancy is effectively full at about 96%, rent growth is surging by double-digits, and yet there’s still almost no new construction.
Between interest rates, construction costs, and the relatively low level of rent rates, new construction of retail space just doesn’t pencil out. Thus, retail supply growth is likely to remain limited for the foreseeable future, increasing the value of existing space and giving room for landlords to push rents.
That is truest for Sunbelt markets where population and job growth has been well above the national average in recent years.
JLL Research Q1 2024 Retail Outlook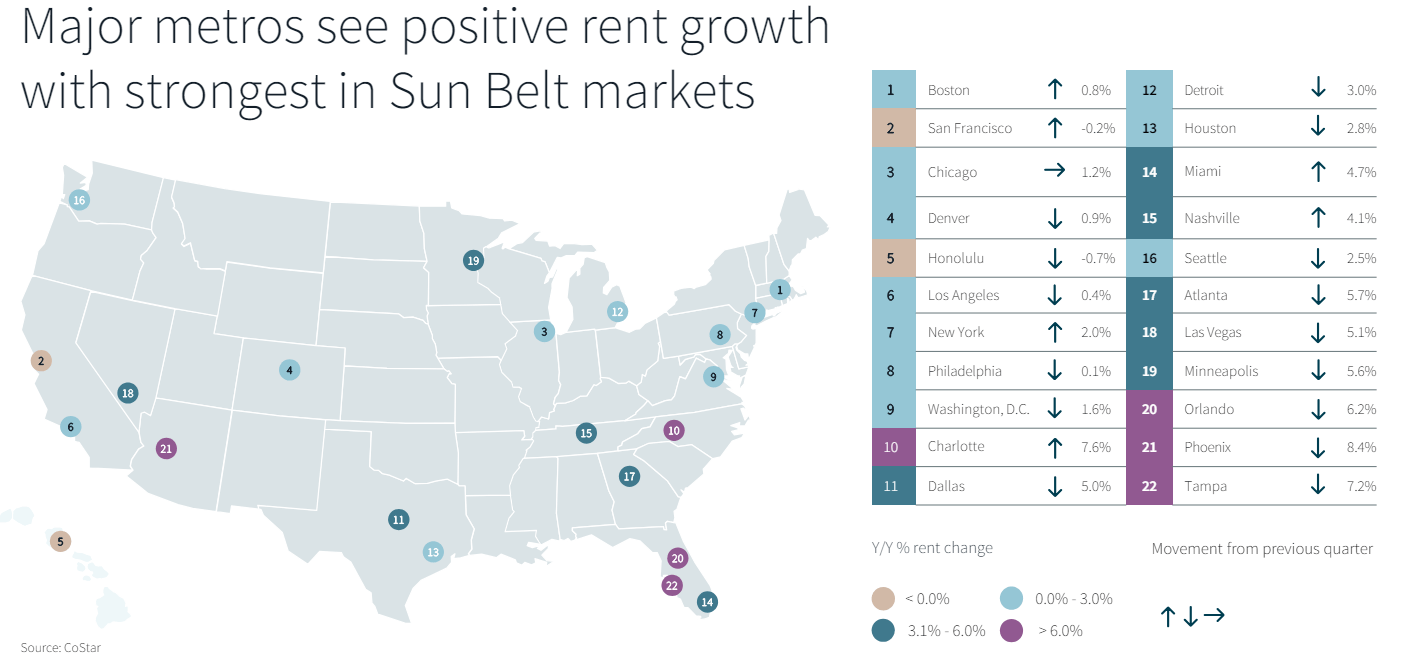
Notice that the markets with the highest levels of rent growth are almost uniformly located in Sunbelt states.
IVT’s grocery-anchored shopping center portfolio is located almost entirely (95%+) in Sunbelt markets, including all four of the fastest growing markets in the image above.
Now, onto the new names on the buy list.
American Homes 4 Rent
AMH is the second largest single-family rental REIT behind Invitation Homes (INVH) and has at least two differentiating factors that make it superior to INVH, in my opinion.
- AMH has an internal development arm that allows it to deliver ~2,000 brand new homes in good neighborhoods to its rental portfolio each year. It can build these homes at a meaningfully higher stabilized yield than cap rates on external acquisitions. INVH does not have an in-house development platform.
- AMH’s portfolio is more heavily concentrated in the Sunbelt and, unlike INVH, has no exposure to California. I believe the Sunbelt will generally enjoy faster population growth and consequently faster rent growth than most non-Sunbelt regions of the country.
However, in general, I am just bullish on the whole SFR space. There has been less growth in the supply of SFRs than of multifamily housing, and yet the Millennial generation are entering their prime single-family living years of life.
Plus, with mortgage rates and home prices both elevated, renting is likely to remain more affordable than buying a home for the foreseeable future.
CBRE Research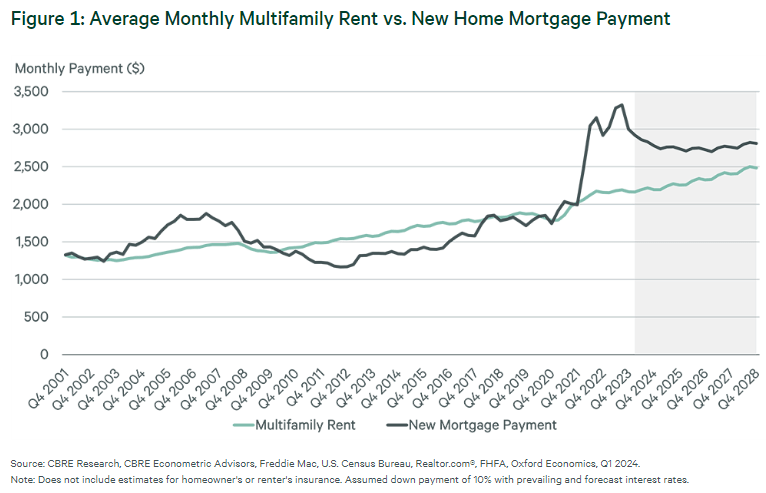
This chart shows the gap between the monthly costs of buying against renting an apartment. It is a bit narrower comparing the monthly costs of buying to renting a single-family home. But it is still more expensive to buy than to rent.
That’s great for incumbent landlords like AMH.
EastGroup Properties
EGP owns and develops multi-tenant, infill industrial parks in a hand-picked selection of primarily Sunbelt markets. Many Sunbelt markets are more exposed to competition from new supply than the average market, but they also enjoy more tenant demand and absorption.
There’s a slowdown in industrial leasing activity right now as tenants wait for some clarity on the direction of the economy, but the long-term outlook for Sunbelt industrial still looks bright.
It certainly doesn’t hurt that e-commerce commands an increasing share of retail spending in the US, even if its growth has stalled somewhat recently.
Chartr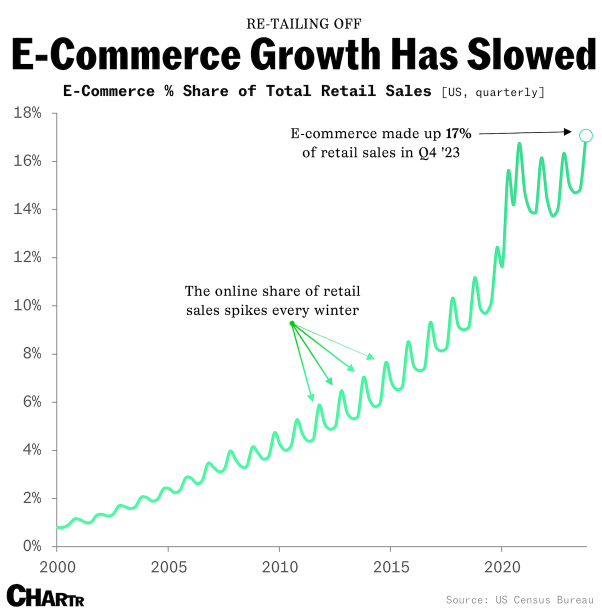
Mid-America Apartment Communities
MAA continues to be punished by the market because of supply headwinds. But the market’s cheap valuation of MAA (~25% discount to its 5-year average valuation) seems to imply that supply growth is so intense that MAA will never be able to return to organic growth. That’s overkill.
Despite the highest level of new supply hitting its markets (as a share of existing inventory) in 50 years, MAA’s occupancy remained strong in Q1 2024 at 95.3%, while turnover of 44.4% is near its lowest level on record.
Given record apartment absorption across the country in Q1 that is poised to hit a three-year high this leasing season, it looks like MAA will skate by relatively unscathed this year and return to growth in the coming years.
Meanwhile, its best-in-class balance sheet with 3.6x net debt to EBITDA gives it ample dry powder with which to pursue attractive acquisition or development opportunities when they come around.
Toronto-Dominion Bank
I have tried to understand TD’s anti-money laundering issues in recent weeks and simply feel that they are beyond me. The story almost sounds like a Hollywood movie, involving alleged bribery of TD employees, money laundering, Chinese crime syndicates, and fentanyl traffickers.
Wow, somebody pitch this to Universal Studios (*ahem* owned by Comcast)!
All levity aside, this does look bad, and even after a provisional charge of $450 million, TD expects more expenses to come from this. But once it’s over, I would expect TD to repair its image and return to acquisitive growth in the US again.
TD has paid a dividend for 167 years, and I don’t expect this (admittedly serious) alleged money laundering issue to break that streak.
VICI Properties
VICI, which I like to call the “landlord of Las Vegas,” owns iconic casino resorts all over the country with its crown jewels lining the legendary Las Vegas strip.
The REIT has already addressed the slightly over $1 billion in debt maturities this year, and it did so with only a minimal increase in interest expenses. But it does have over double the amount of debt maturities next year, which will create a bit more of a headwind to bottom-line growth, unless interest rates decline meaningfully from here.
That said, VICI enjoys strong rent escalations of about 2% on its existing portfolio and has continued to invest accretively, which should more than offset the headwind from higher interest costs.