SlavkoSereda/iStock via Getty Images
Volatility Metrics
Volatility, as measured by the VIX, is currently averaging 14.7 in 2QTD, down 11% from 16.5 in 2Q23 but up 7% from 13.7 in 1Q24. Additionally, realized volatility, as measured by daily changes in the closing value of the S&P 500 is tracking at 14.3 in 2QTD, down 9% from 15.7 in 2Q23 but up 4% from 13.7 in 1Q24.
Yahoo Finance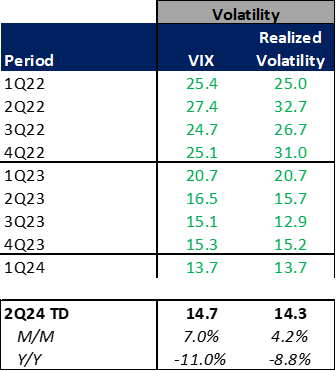
U.S. Equities, Equity Options, & Index Options
Meanwhile, total U.S. equity volumes are tracking at 11.6 billion per day, up 8% from 10.8 billion in 2Q23 but down 1% from 11.8 billion in 1Q24. Additionally, total industry equity options volumes are tracking at 41 million per day, up 5% from 2Q23 but down 5% from 43.3 million in 1Q24. Industry Index option volumes are currently averaging 4.1 million per day in 2Q24TD, up 11% vs. 3.7 million in 2Q23 but down 1% from 1Q24.
Cboe and OCC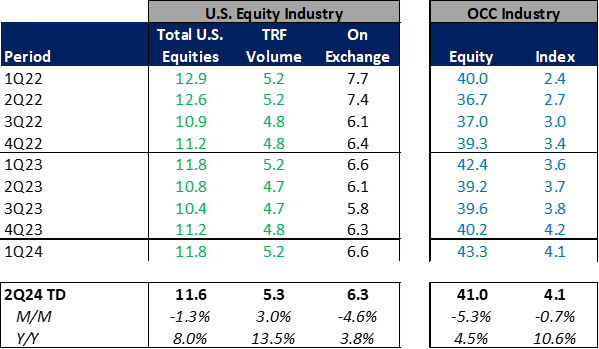
Exchange-Specific Volumes
Nasdaq, Inc. (NDAQ)
Nasdaq’s U.S. equity volume is averaging 1.8 billion per day in 2Q24TD, down 1% relative to 2Q23 but down 5% relative to 1Q24. Based on QTD ADV, Nasdaq has lost 144 basis points of market share in U.S. equities relative to 2Q23 and 65 basis points of market share relative to 1Q24. Additionally, Nasdaq’s U.S. equity options volume is averaging 11.9 million contracts per day, down 2% relative to 2Q23 and down 6% relative to 1Q24. Based on QTD ADV, Nasdaq has lost 176 basis points of market share in U.S. equity options relative to 2Q23 and 31 basis points of market share relative to 1Q24.
Cboe and OCC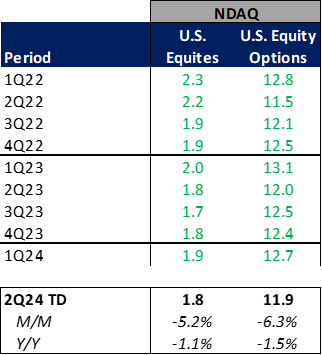
Cboe Global Markets, Inc. (CBOE)
Cboe’s U.S. equity volume is averaging 1.4 billion per day in 2Q24TD, down 1% relative to 2Q23 but down 10% relative to 1Q24. Based on QTD ADV, Cboe has lost 102 basis points of market share in U.S. equities relative to 2Q23 and 113 basis points of market share relative to 1Q24. The market share decline makes sense, given that Cboe mentioned on its 4Q23 earnings call that it had implemented some pricing changes in U.S. equities designed to increase revenue capture (at the potential expense of market share). Additionally, Cboe’s U.S. equity options volume is averaging 10.1 million contracts per day, down 5% relative to 2Q23 and down 6% relative to 1Q24. Based on QTD ADV, Cboe has lost 255 basis points of market share in U.S. equity options relative to 2Q23 and 29 basis points of market share relative to 1Q24. Meanwhile, Cboe’s index option volumes are averaging 4.1 million contracts per day in 2Q24TD, up 10% Y/Y but down 1% from 1Q24. Additionally, Cboe’s futures volumes are averaging 262k per day, up 33% from 2Q23 and up 19% from 1Q24 levels while FX volumes are averaging $45.7 billion per day, up 8% from 2Q23 and up 1% from 1Q24.
Cboe and OCC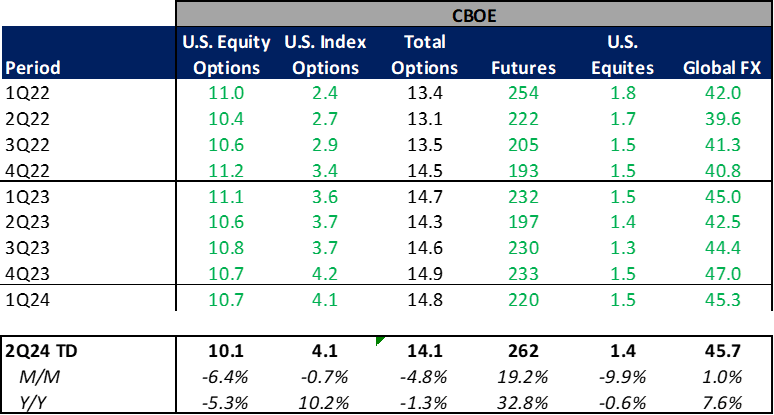
Intercontinental Exchange, Inc. (ICE)
Intercontinental Exchange’s U.S. equity volume is averaging 2.4 billion per day in 2Q24TD, up 11% relative to 2Q23 but down 11% relative to 1Q24. Based on QTD ADV, Intercontinental Exchange has gained 52 basis points of market share in U.S. equities relative to 2Q23 but has lost 4 basis points of market share relative to 1Q24. Additionally, Intercontinental Exchange’s U.S. equity options volume is averaging 9.2 million contracts per day, up 19% relative to 2Q23 but down 2% relative to 1Q24. Based on QTD ADV, Intercontinental Exchange has gained 278 basis points of market share in U.S. equity options relative to 2Q23 and 87 basis points of market share relative to 1Q24. In terms of Intercontinental Exchange’s futures volumes, Energy volume is averaging 4.2 million contracts per day, up 28% Y/Y but down 3% relative to 1Q24, while Ags & Metals contracts are averaging 0.5 million per day, down 10% vs. 2Q23 and down 12% relative to 1Q24, and Financials volume is tracking at 3.0 million contracts per day, up 36% Y/Y but down 7% relative to 1Q24 levels.
Intercontinental Exchange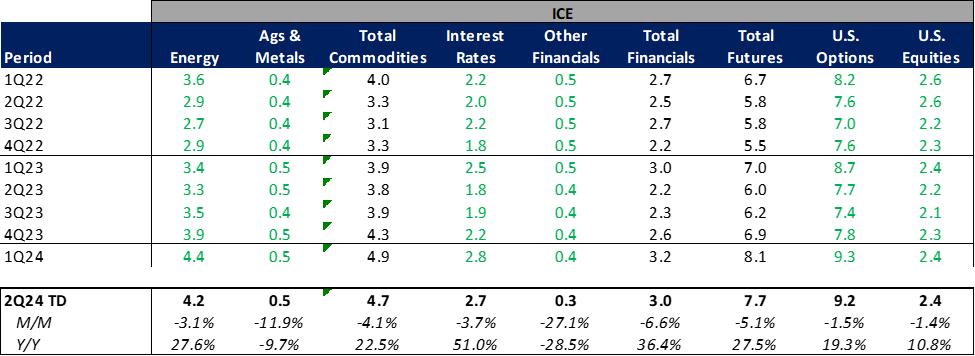
CME Group Inc. (CME)
CME Group’s total futures and options complex volume is averaging 26.2 million contracts per day in 2Q24TD, up 15% Y/Y but down 1% from 1Q24 levels. By product line, Interest Rate futures and options are averaging 13.5 million contracts per day, up 20% Y/Y but down 2% from 1Q24, Equities contracts are averaging 6.7 million contracts per day, up 7% Y/Y but down 3% from 1Q24, FX contracts are averaging 0.9 million per day, up 4% Y/Y but down 5% from 1Q24, Agricultural contracts are averaging 1.8 million per day, unchanged Y/Y but up 10% from 1Q24, Energy contracts are averaging 2.4 million per day, up 15% Y/Y and roughly flat with 1Q24 levels, and Metals contracts are averaging 1.0 million per day, up 55% Y/Y and up 41% from 1Q24 levels.
CME Group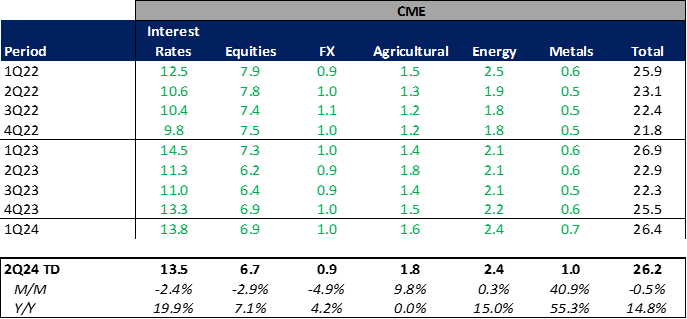
What This Means For the Exchanges
In terms of how the above translates into revenues for the exchanges, CME Group’s performance in 2Q24TD has been the strongest relative to what the company reported in the prior year period, suggesting the most upside to 2Q24 transaction revenues on a YoY basis. Intercontinental Exchange shows the second most upside relative to year ago transaction revenue results – primarily driven by outperformance YoY in Intercontinental Exchange’s futures volumes. Cboe shows the next highest YoY potential improvement in transaction-related revenue – driven primarily by strength in index options and futures volumes. Nasdaq’s performance on transaction revenues looks to be relatively in line with what they reported a year ago, based on QTD volumes.
Based on the QTD volume information, I would suggest buying CME Group and Cboe on the anticipation of upward revisions to transaction revenue estimates, particularly given the recent performance of these two companies relative to the other exchanges (CME Group down 7% over the last 3 months and CBOE down 9%). I would also consider buying ICE given it is down 4% in the last 3 months despite transaction revenues likely increasing 15% YoY in 2Q. I would not suggest making changes to my position on Nasdaq based on QTD volume information, as transaction revenues are likely to remain unchanged YoY (note that Nasdaq has the lowest exposure to transaction-based revenues which is part of the reason why I retain my Strong Buy rating on the stock).