Vertigo3d
Leveraged ETFs like the GraniteShares 2x Long META Daily ETF (NASDAQ:FBL) can be quite scary and attractive at the same time. It’s attractive when you look at its 65% YTD return against Meta Platforms’ (META) 39% return, but it’s scary when you see the dynamics of how such an ETF works. I’ve written quite a bit about leveraged ETFs here on Seeking Alpha, so in the interest of saving time, I’d invite you to read detailed risks in one of those. I’ll summarize them here, but a closer look might be a good idea if you’re new to leveraged products.
Summary of Leveraged ETF Risks
I’ll get straight to eating the frog so we can enjoy the rest of the meal at our leisure. Essentially, these are the risks you need to be aware of.
-
The key risk is the daily reset characteristic of such ETFs. Since they’re designed to track the daily performance of the underlying asset, they reset at the end of each trading day. In this case, it would mean a 10% hit to your holding if META fell 5%. At the end of that day, the fund resets or rebalances, so you’re essentially starting the next day from scratch. It’s more complicated than I make it sound, but this is the only way a leveraged or inverse ETF can reasonably meet its objective of delivering a 1x, 2x, 3x or any inverse return that it aims to give you.
-
Another risk that’s related to this daily reset is the compounding risk. Due to the daily reset, any continued string of losses could theoretically be much more than the individual daily loss. Without getting into the calculations, suffice it to say that the risk is great enough for FINRA to have a specific rule about it for registered investment advisors and brokerage firms handling institutional accounts. Now called “2111. Suitability,” this rule states, in part, that:
A member or an associated person must have a reasonable basis to believe that a recommended transaction or investment strategy involving a security or securities is suitable for the customer
I strongly urge you to read both FINRA’s rule about leveraged products, and the SEC’s warnings.
A Closer Look at FBL from the Technical Side
You might have wondered why FBL didn’t deliver closer to 80% when META itself did half that. Isn’t the fund supposed to return 2X what META does? No, that’s not how it’s calculated. By now, the risks section should have clued you in, but for clarity’s sake, this is not a like for like comparison just because both are YTD figures. This is the cumulative return on aiming for a 2X daily return, which is why your holding period should never be more than a full trading day. If you’re a more experienced investor, a few days should be your absolute maximum threshold. Due to the daily reset, you won’t see that 2X return on anything more than a daily basis.
My suggested strategy involves holding FBL for 1 to 3 days at a time, but only when momentum indicators are clearly bullish. I’ve discussed this in past articles, but it’s worth mentioning again. Let’s look at META’s daily movements over the past month for this.
SA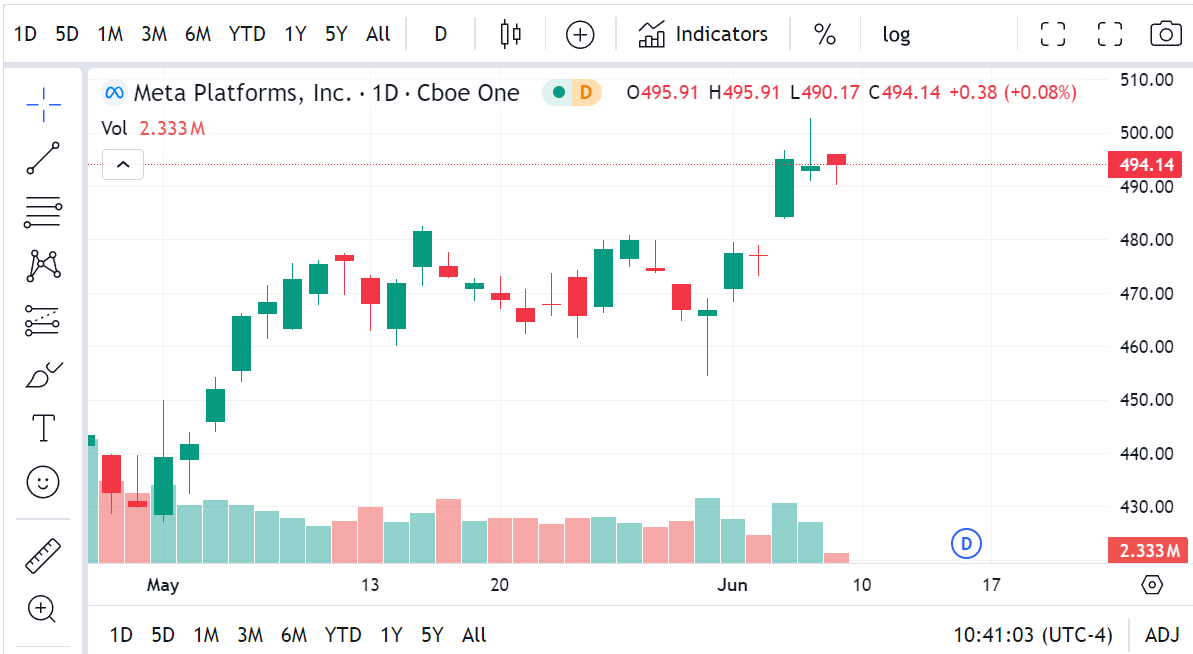
The broader picture tells you that the first week of May would have been a good time to enter and exit an FBL position. But within this chart also lay some strong one-day and two-day momentum opportunities. This is what you’ll need to look for. The problem is that all of this is backward-looking, so how do you tell if the momentum you see today is sustainable over the next one, two, or more days? That’s where your momentum indicators are helpful.
There are some well-known indicators you can use, such as RSI and ROC, which essentially measure closing prices against historical data for a specific number of earlier periods to show if a stock is overbought or oversold, and how rapidly that rate of price change is occurring. Let’s look at how these are used in this context.
SA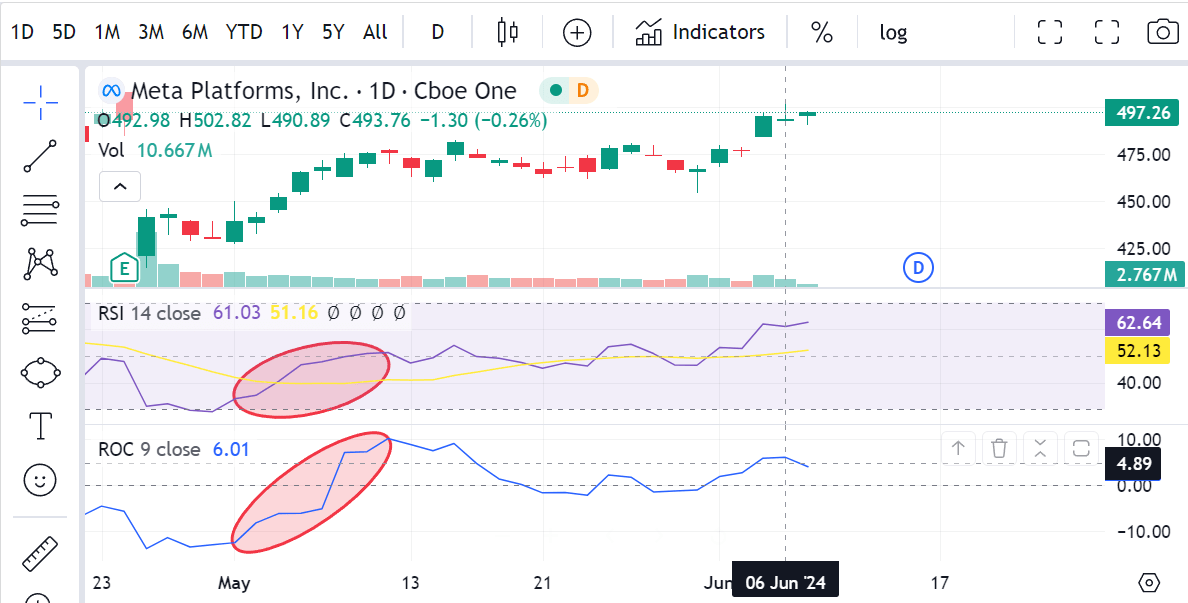
Please be aware that I’m not necessarily recommending this strategy. This is simply an example to show how such indicators can help you gauge the positive momentum of the underlying, which is a prerequisite when you’re dealing with leveraged ETFs. The same applies to inverse and inverse leveraged exchange-traded products, but in the opposite direction. These indicators need to be watched very closely so you can time your exit. The moment you see any weakness in relative strength or a slowdown in the rate of price change, it’s better to retreat and live to fight another day.
Similar to what I’ve highlighted in the chart above, you’ll notice other opportunities where RSI and ROC clearly indicated positive price momentum that would last for more than a day. Those are the entry-point indicator signals, and you can see a couple of them right after May 21 on the chart.
Of course, this leads to additional risks in the form of costs over and above the ETF’s expense ratio, which in this case is a fairly hefty 1.15% but reasonable when you look at the kind of leveraged gains you can enjoy if this is done right. You’ll also need to consider trading costs as well as short-term capital gains. On the whole, however, many investors have found that it’s worth the additional cost and risk if the result is a significant gain over the underlying asset; in this case, META.
Other momentum indicators you can use are the ADX or Average Directional Index to compare a price range to historical periods, the CCI or Commodity Channel Index to identify range breaks, and the very popular MACD or Moving Average Convergence Divergence indicator. Each one is based on sound mathematical principles and has been tested and back tested endlessly by technicians, but learning how to read them in a way that helps you identify entry and exit points is an art that can only be learned over time.
Now for the Fundamental Side of Things
TA experts will swear by their tangible results of the past, but many investors are more comfortable gauging performance based on fundamental analysis, or a combination of both. Both are equally effective in the right hands, and the choice is mainly one of preferring the nuances of one over the other. I’d recommend a blended approach, so any signals in one are either validated or negated by signals in the other. I tend to assign more value to signals that disconfirm a hypothesis built on other signals rather than confirm it – just to make sure that I’m not a victim of confirmation bias, as many of us often are.
In terms of fundamentals, META is strong on nearly every front.
Revenue growth projections for the next few years, for example, show healthy double-digit percentage growth at the top over FY24 and FY25. In its most recent quarter, META posted a 27% revenue growth rate – not something you’d expect to see with a $1.25 trillion market cap company, but there you have it. On an annual basis, META has doubled its revenues between FY 19 and the TTM period, which is not bad for a 4+ year growth rate by any standard.
At the bottom line as well, META has shown tremendous resilience as well, going from a 26% net income margin in FY19 to the current 32% for the TTM period. The company did see a profitability dip in FY22 but has rebounded very nicely.
As a result, you can see META’s price momentum beating the market on every single time frame.
SA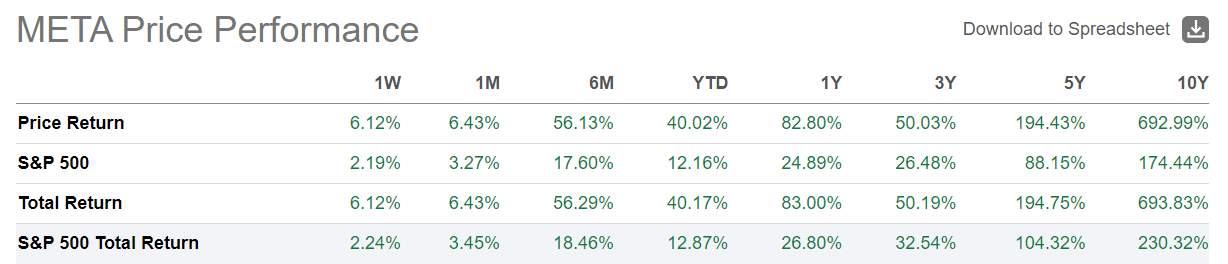
Investors are clearly rewarding the company handsomely – perhaps not for the heavy investments it’s been making in forward-looking technologies, but certainly for the kind of tremendous growth it has shown in the face of nearly every adversity, including market skepticism to a point. It’s amply clear from its strong growth profile across the board that this is a mega cap you’ll want to keep your eyes on, and perhaps get your paws into.
SA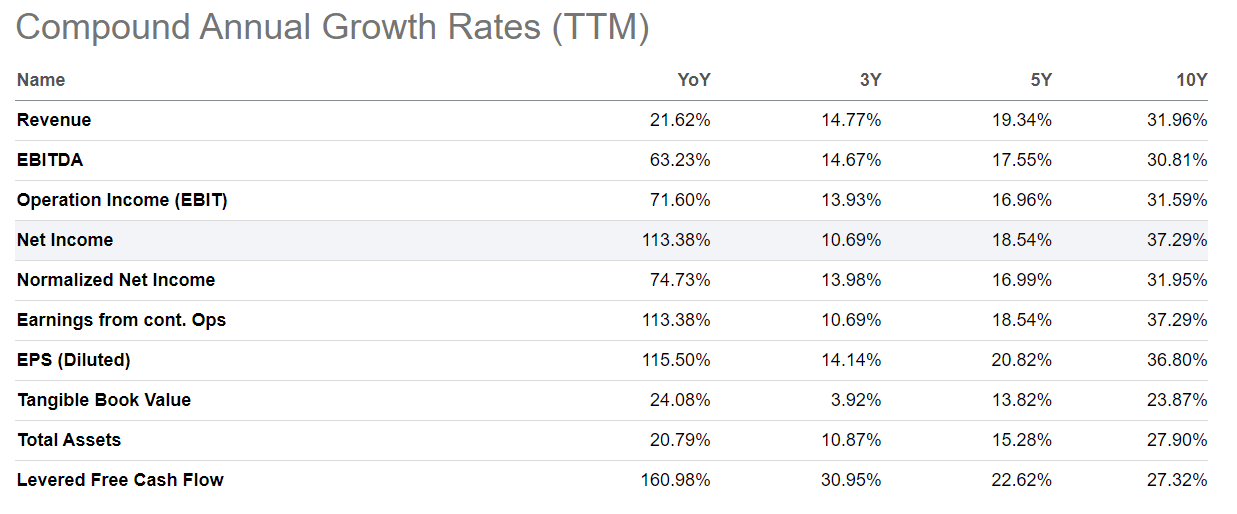
So, should you take a risk on FBL?
I’m recommending a Buy here, but I don’t want anyone to interpret this as being part of a buy and hold strategy. The Buy here is specifically in the context of using leverage in the least risky way possible – by letting the experts at GraniteShares do the hard work in exchange for the reasonable expense ratio.
SA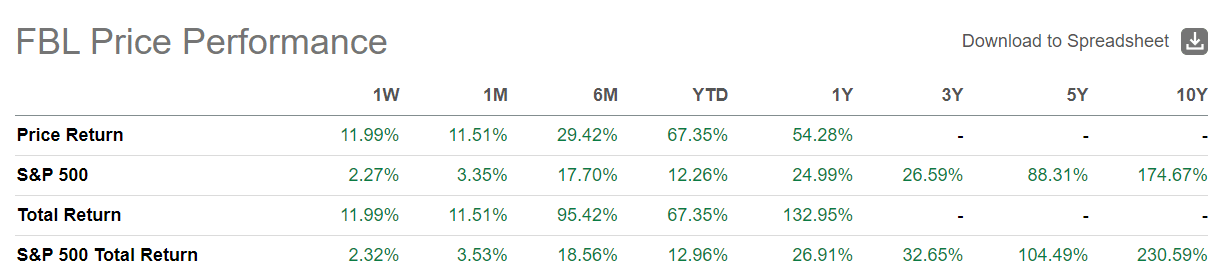
The price and total return profiles of FBL look attractive, and if you play this right, you could see returns as high as 4 to 5 times what the broader market would have yielded. For additional context, Street analysts, as reported by Barron’s, have an average price target of around $522 against a current as-of-writing share price of $496, which gives you an upside potential of around 5%. That’s not very promising, but 48 of the 66 analysts on Barron’s are still rating META a Buy, with a high-end price target of $600, so that’s a much more optimistic upside scenario of +20%. Regardless of the optimism, if you choose to trade FBL, make sure you’re aware of the risks and aren’t betting what you can’t afford to lose. I’ll leave you with that.
Thank you for reading, and I welcome all comments. All opinions stated here are my own, and I expect that readers understand that their own due diligence is a crucial layer on top of any suggestions made regarding a particular security.