TradingView’s fixed range volume profile can quickly reveal where buyers and sellers have conducted the most business. The difficult part is not adding the tool. It is choosing the right range to analyse.
Technical analysis can become confusing when a chart contains too many indicators, moving averages and isolated price levels. A fixed range volume profile offers a cleaner starting point because it shows where trading activity was concentrated during a specific period.
However, the tool is only as useful as the range selected. Anchor it to an arbitrary date and the resulting levels may have little relevance. Anchor it to the active market structure and it can quickly reveal the technical premise, including potential support, resistance and fair value.
A supportive fundamental backdrop for the British pound
The starting point for this GBP/USD analysis came from a recent weekly market review by Michael Stark at Exness (thanks, Michael, they are helpfu, keep ’em coming 🙂
Stark highlighted improving sentiment toward the UK political outlook, with markets increasingly expecting policy continuity rather than a sudden change in economic direction. Greater political stability can reduce the risk premium attached to British assets, improve investor confidence and support the pound.
The backdrop is supportive, but not completely one-sided. UK inflation may be slowing, which reduces the urgency for the Bank of England to raise interest rates immediately. The pound will therefore remain sensitive to incoming economic data and changing interest-rate expectations.
For new currency traders, remember that GBP/USD tells us how many US dollars are required to buy one British pound.
- GBP/USD at 1.35 means £1 costs $1.35.
- If the pound strengthens while the dollar remains unchanged, GBP/USD should rise.
- If the US dollar strengthens more quickly than the pound, GBP/USD can fall even when UK news is reasonably positive.
That last point is important. Every currency pair reflects the relative strength of two currencies, not the outlook for only one economy.
What is a fixed range volume profile?
A conventional volume indicator shows how much trading occurred during each candle or period.
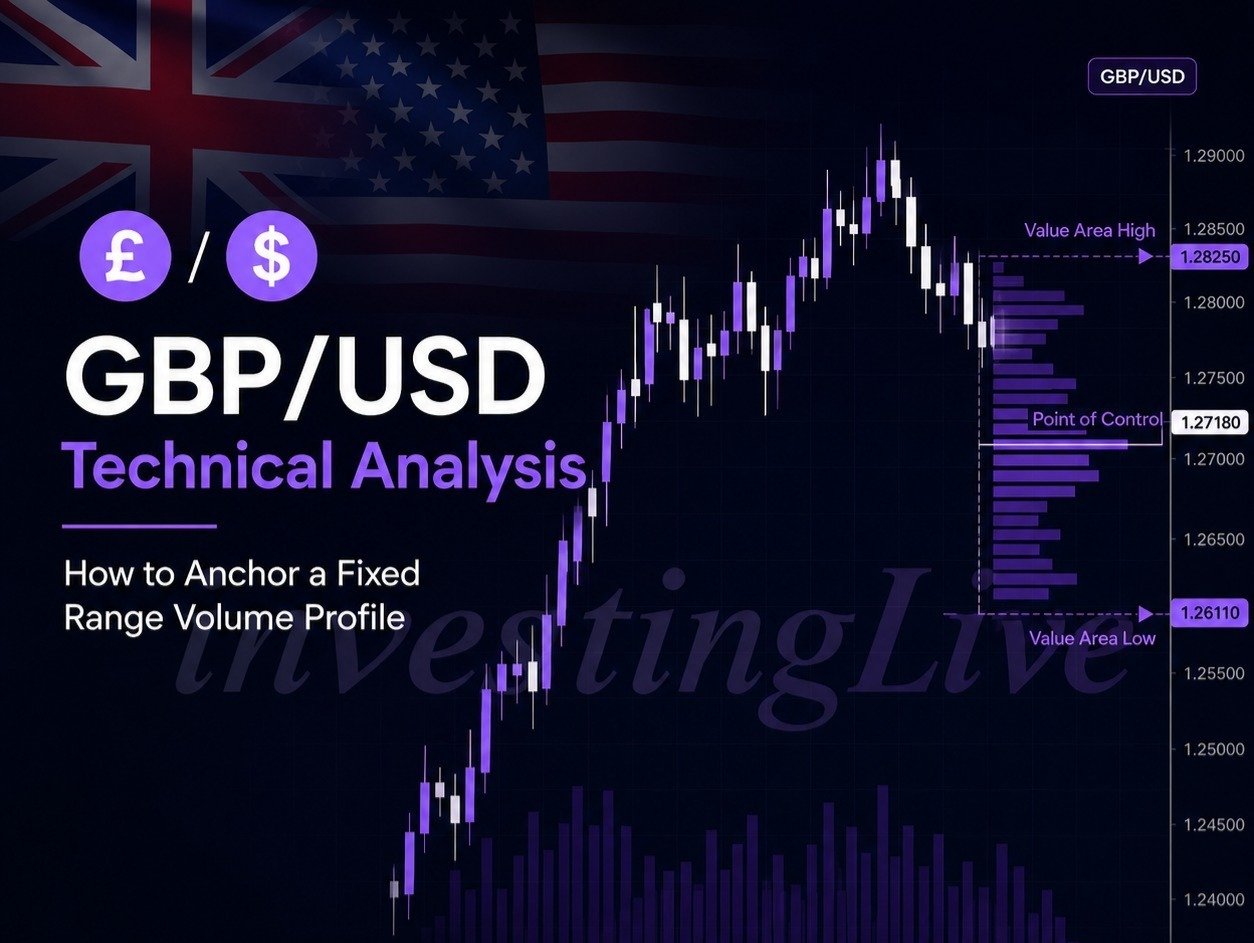
A volume profile reorganises that information by price. It shows where the greatest amount of trading took place within the selected range.
The three main references are:
Point of control, or POC
The POC is the price at which the largest amount of volume was transacted during the selected period. It can be viewed as the market’s most accepted price, or approximate fair value, for that particular auction.
Value area high, or VAH
The value area high marks the upper boundary of the main value area.
Value area low, or VAL
The value area low marks the lower boundary.
Depending on the platform settings, the value area normally contains approximately 68% to 70% of all volume transacted during the selected period.
These are not guaranteed reversal levels. They are areas where traders can expect decisions, changes in positioning and potentially increased two-way activity.
How to choose the correct anchor
This is the most important part of the process.
Do not automatically begin the profile at the oldest visible candle, the previous calendar year or a random major high. First identify the range in which the market is currently trading.
In the GBP/USD example shown in the video, the broader structure extends roughly from 1.30 to 1.39. The profile is therefore drawn around the price action belonging to that range, rather than from an unrelated move much further back on the chart.
The process is:
- Start on the monthly or weekly chart.
The higher timeframe makes the active range easier to recognise. - Identify the current auction.
Look for the group of candles trading within the same broad price boundaries. - Place the first anchor at the beginning of that structure.
In this example, the selected range begins around 11 April 2025. - Extend the profile through the latest price action.
The current market activity should remain part of the calculation. - Only then move to the daily or intraday chart.
Smaller timeframes can be used for execution, but the broader profile provides the initial map.
This approach helps prevent traders from getting lost in the forest of individual candles.
What the GBP/USD profile currently shows
At the time of the video, GBP/USD was trading near 1.3464, while the fixed range POC was located around 1.34.
That places the pair relatively close to the profile’s fair-value area. Price had previously advanced toward the value area high before pulling back toward the POC.
This produces a more cautious technical premise than simply saying that improving UK sentiment means traders should immediately buy GBP/USD.
The fundamental backdrop may favour sterling, but price is no longer starting from a deeply discounted location. It is trading near an important area of accepted value.
That means traders can monitor how GBP/USD behaves around the POC:
- Holding above or reclaiming the POC would suggest that buyers are continuing to defend the central value area.
- Repeated rejection below the POC would indicate that the market is beginning to accept lower prices.
- A return toward the value area high would test whether the recent bullish move can develop into genuine continuation.
- Acceptance below the main value area would weaken the immediate bullish interpretation and expose lower references within the broader range.
The monthly chart also identifies the 1.30 area as a potentially important longer-term support or price magnet. It is not an immediate target, but it helps define the lower boundary of the larger structure.
Why these levels can influence price
Volume-profile levels matter partly because many professional and systematic traders are watching similar areas.
The exact calculations may differ slightly between TradingView, NinjaTrader and other platforms, but the resulting POC and value-area references are usually close enough to create common areas of interest.
For example, when price reaches an important lower profile level, profitable short sellers may begin covering their positions.
Closing a short requires buying the instrument back. That can temporarily increase buying pressure and contribute to a bounce, even when the broader trend remains bearish.
This does not mean every profile level will reverse the market. It means traders may use those areas to:
- Take partial profits
- Reduce exposure
- Watch for a reversal or continuation pattern
- Place invalidation beyond the level rather than directly on it
- Avoid entering after a move has already become extended
The video explains this practical use of the levels, including how short covering can affect price near an important support area.
Use volume profile as a map, not a complete strategy
A fixed range volume profile can provide a surprisingly useful market overview within a few minutes.
It answers three initial questions:
- Where has the greatest amount of trading occurred?
- Is price currently above, below or inside accepted value?
- Which levels are most likely to become decision areas?
It does not answer everything.
Traders still need to assess trend, volatility, economic events and the behaviour of the second currency in the pair. They may also use smaller timeframes to look for confirmation before entering a position.
In the current GBP/USD example, improving UK political sentiment provides a constructive backdrop for sterling. The volume profile, however, suggests that traders should still pay close attention to the reaction around the POC rather than automatically chasing the pound after its recent rise.
The objective is not to predict every candle. It is to turn a complicated chart into a structured map of value, acceptance and potential support or resistance.
This article is for educational purposes only and is not financial advice. Trading involves risk. Conduct your own research and manage risk appropriately.
Frequently asked questions for traders, investors and beginner through advanced chartists
What is a fixed range volume profile?
A fixed range volume profile shows how much trading activity occurred at each price within a selected period. Unlike a conventional volume indicator, which displays volume by time, it helps traders identify fair value, potential support, resistance and important decision areas by price.
How do I anchor a fixed range volume profile correctly?
Begin by identifying the active market structure on a weekly or monthly chart. Place the first anchor at the start of the current trading range, then extend the profile through the latest price action. Avoid anchoring it to an arbitrary date or an unrelated historical high or low.
Where was the GBP/USD volume profile anchored in this analysis?
The profile began around 11 April 2025, near the start of the broader structure currently being analysed. That structure extends approximately from 1.30 to 1.39.
What is the point of control in volume profile analysis?
The point of control, or POC, is the price where the greatest amount of volume was transacted during the selected range. It represents an approximate fair-value or acceptance level for that particular market structure.
What do value area high and value area low mean?
Value area high, or VAH, marks the upper boundary of the main value area. Value area low, or VAL, marks its lower boundary. Together, the value area usually contains approximately 68% to 70% of the volume traded during the selected period.
What does the GBP/USD volume profile currently suggest?
At the time of the analysis, GBP/USD was trading near 1.3464, relatively close to the profile’s POC around 1.34. This suggests that the pair was near an important area of accepted value rather than at a deeply discounted price. The reaction around the POC may help indicate whether buyers remain in control or lower prices are gaining acceptance.
Is the GBP/USD outlook bullish?
Improving UK political sentiment provides a constructive backdrop for the British pound. However, the technical outlook remains conditional. Holding above or reclaiming the POC would support the bullish case, while repeated rejection below it would suggest weakening demand and possible acceptance at lower prices.
Are volume-profile levels guaranteed to reverse price?
No. POC, VAH and VAL are decision areas, not guaranteed reversal points. Traders can watch them for evidence of acceptance, rejection, continuation or reversal, while also considering trend, volatility, economic events and risk management.
Why can price react around volume-profile levels?
Many discretionary, professional and systematic traders monitor similar areas. Price may also react because existing traders adjust their positions there. For example, short sellers covering profitable positions near support must buy the currency pair back, potentially contributing to a temporary bounce.
Which timeframe should beginners use?
Start with the monthly or weekly chart to identify and anchor the broader structure. Once the profile is established, move to the daily or intraday chart to study price behaviour and possible execution opportunities.
Can a fixed range volume profile be used as a complete trading strategy?
No. It is best treated as a market map. It can show where value developed and where important decisions may occur, but traders should also assess trend, volatility, upcoming economic data, the relative strength of both currencies and confirmation from price action.
Why does the US dollar matter when analysing GBP/USD?
GBP/USD reflects the relative strength of the British poh1 data-section-id=”1d83fhm” data-start=”0″ data-end=”86″ class=”PDq2pG_selectionAnchorContainer”>GBP/USD technical analysis for beginners: How to anchor a fixed range volume profile
TradingView’s fixed range volume profile can quickly reveal where buyers and sellers have conducted the most business. The difficult part is not adding the tool. It is choosing the right range to analyse.
Technical analysis can become confusing when a chart contains too many indicators, moving averages and isolated price levels. A fixed range volume profile offers a cleaner starting point because it shows where trading activity was concentrated during a specific period.
However, the tool is only as useful as the range selected. Anchor it to an arbitrary date and the resulting levels may have little relevance. Anchor it to the active market structure and it can quickly reveal the technical premise, including potential support, resistance and fair value.
A supportive fundamental backdrop for the British pound
The starting point for this GBP/USD analysis came from a recent weekly market review by Michael Stark at Exness (thanks, Michael, they are helpfu, keep ’em coming 🙂
Stark highlighted improving sentiment toward the UK political outlook, with markets increasingly expecting policy continuity rather than a sudden change in economic direction. Greater political stability can reduce the risk premium attached to British assets, improve investor confidence and support the pound.
The backdrop is supportive, but not completely one-sided. UK inflation may be slowing, which reduces the urgency for the Bank of England to raise interest rates immediately. The pound will therefore remain sensitive to incoming economic data and changing interest-rate expectations.
For new currency traders, remember that GBP/USD tells us how many US dollars are required to buy one British pound.
- GBP/USD at 1.35 means £1 costs $1.35.
- If the pound strengthens while the dollar remains unchanged, GBP/USD should rise.
- If the US dollar strengthens more quickly than the pound, GBP/USD can fall even when UK news is reasonably positive.
That last point is important. Every currency pair reflects the relative strength of two currencies, not the outlook for only one economy.
What is a fixed range volume profile?
A conventional volume indicator shows how much trading occurred during each candle or period.
A volume profile reorganises that information by price. It shows where the greatest amount of trading took place within the selected range.
The three main references are:
Point of control, or POC
The POC is the price at which the largest amount of volume was transacted during the selected period. It can be viewed as the market’s most accepted price, or approximate fair value, for that particular auction.
Value area high, or VAH
The value area high marks the upper boundary of the main value area.
Value area low, or VAL
The value area low marks the lower boundary.
Depending on the platform settings, the value area normally contains approximately 68% to 70% of all volume transacted during the selected period.
These are not guaranteed reversal levels. They are areas where traders can expect decisions, changes in positioning and potentially increased two-way activity.
How to choose the correct anchor
This is the most important part of the process.
Do not automatically begin the profile at the oldest visible candle, the previous calendar year or a random major high. First identify the range in which the market is currently trading.
In the GBP/USD example shown in the video, the broader structure extends roughly from 1.30 to 1.39. The profile is therefore drawn around the price action belonging to that range, rather than from an unrelated move much further back on the chart.
The process is:
- Start on the monthly or weekly chart.
The higher timeframe makes the active range easier to recognise. - Identify the current auction.
Look for the group of candles trading within the same broad price boundaries. - Place the first anchor at the beginning of that structure.
In this example, the selected range begins around 11 April 2025. - Extend the profile through the latest price action.
The current market activity should remain part of the calculation. - Only then move to the daily or intraday chart.
Smaller timeframes can be used for execution, but the broader profile provides the initial map.
This approach helps prevent traders from getting lost in the forest of individual candles.
What the GBP/USD profile currently shows
At the time of the video, GBP/USD was trading near 1.3464, while the fixed range POC was located around 1.34.
That places the pair relatively close to the profile’s fair-value area. Price had previously advanced toward the value area high before pulling back toward the POC.
This produces a more cautious technical premise than simply saying that improving UK sentiment means traders should immediately buy GBP/USD.
The fundamental backdrop may favour sterling, but price is no longer starting from a deeply discounted location. It is trading near an important area of accepted value.
That means traders can monitor how GBP/USD behaves around the POC:
- Holding above or reclaiming the POC would suggest that buyers are continuing to defend the central value area.
- Repeated rejection below the POC would indicate that the market is beginning to accept lower prices.
- A return toward the value area high would test whether the recent bullish move can develop into genuine continuation.
- Acceptance below the main value area would weaken the immediate bullish interpretation and expose lower references within the broader range.
The monthly chart also identifies the 1.30 area as a potentially important longer-term support or price magnet. It is not an immediate target, but it helps define the lower boundary of the larger structure.
Why these levels can influence price
Volume-profile levels matter partly because many professional and systematic traders are watching similar areas.
The exact calculations may differ slightly between TradingView, NinjaTrader and other platforms, but the resulting POC and value-area references are usually close enough to create common areas of interest.
For example, when price reaches an important lower profile level, profitable short sellers may begin covering their positions.
Closing a short requires buying the instrument back. That can temporarily increase buying pressure and contribute to a bounce, even when the broader trend remains bearish.
This does not mean every profile level will reverse the market. It means traders may use those areas to:
- Take partial profits
- Reduce exposure
- Watch for a reversal or continuation pattern
- Place invalidation beyond the level rather than directly on it
- Avoid entering after a move has already become extended
The video explains this practical use of the levels, including how short covering can affect price near an important support area.
Use volume profile as a map, not a complete strategy
A fixed range volume profile can provide a surprisingly useful market overview within a few minutes.
It answers three initial questions:
- Where has the greatest amount of trading occurred?
- Is price currently above, below or inside accepted value?
- Which levels are most likely to become decision areas?
It does not answer everything.
Traders still need to assess trend, volatility, economic events and the behaviour of the second currency in the pair. They may also use smaller timeframes to look for confirmation before entering a position.
In the current GBP/USD example, improving UK political sentiment provides a constructive backdrop for sterling. The volume profile, however, suggests that traders should still pay close attention to the reaction around the POC rather than automatically chasing the pound after its recent rise.
The objective is not to predict every candle. It is to turn a complicated chart into a structured map of value, acceptance and potential support or resistance.
This article is for educational purposes only and is not financial advice. Trading involves risk. Conduct your own research and manage risk appropriately.
Frequently asked questions for traders, investors and beginner through advanced chartists
What is a fixed range volume profile?
A fixed range volume profile shows how much trading activity occurred at each price within a selected period. Unlike a conventional volume indicator, which displays volume by time, it helps traders identify fair value, potential support, resistance and important decision areas by price.
How do I anchor a fixed range volume profile correctly?
Begin by identifying the active market structure on a weekly or monthly chart. Place the first anchor at the start of the current trading range, then extend the profile through the latest price action. Avoid anchoring it to an arbitrary date or an unrelated historical high or low.
Where was the GBP/USD volume profile anchored in this analysis?
The profile began around 11 April 2025, near the start of the broader structure currently being analysed. That structure extends approximately from 1.30 to 1.39.
What is the point of control in volume profile analysis?
The point of control, or POC, is the price where the greatest amount of volume was transacted during the selected range. It represents an approximate fair-value or acceptance level for that particular market structure.
What do value area high and value area low mean?
Value area high, or VAH, marks the upper boundary of the main value area. Value area low, or VAL, marks its lower boundary. Together, the value area usually contains approximately 68% to 70% of the volume traded during the selected period.
What does the GBP/USD volume profile currently suggest?
At the time of the analysis, GBP/USD was trading near 1.3464, relatively close to the profile’s POC around 1.34. This suggests that the pair was near an important area of accepted value rather than at a deeply discounted price. The reaction around the POC may help indicate whether buyers remain in control or lower prices are gaining acceptance.
Is the GBP/USD outlook bullish?
Improving UK political sentiment provides a constructive backdrop for the British pound. However, the technical outlook remains conditional. Holding above or reclaiming the POC would support the bullish case, while repeated rejection below it would suggest weakening demand and possible acceptance at lower prices.
Are volume-profile levels guaranteed to reverse price?
No. POC, VAH and VAL are decision areas, not guaranteed reversal points. Traders can watch them for evidence of acceptance, rejection, continuation or reversal, while also considering trend, volatility, economic events and risk management.
Why can price react around volume-profile levels?
Many discretionary, professional and systematic traders monitor similar areas. Price may also react because existing traders adjust their positions there. For example, short sellers covering profitable positions near support must buy the currency pair back, potentially contributing to a temporary bounce.
Which timeframe should beginners use?
Start with the monthly or weekly chart to identify and anchor the broader structure. Once the profile is established, move to the daily or intraday chart to study price behaviour and possible execution opportunities.
Can a fixed range volume profile be used as a complete trading strategy?
No. It is best treated as a market map. It can show where value developed and where important decisions may occur, but traders should also assess trend, volatility, upcoming economic data, the relative strength of both currencies and confirmation from price action.
Why does the US dollar matter when analysing GBP/USD?
400px; height: 345px;”>
Technical analysis can become confusing when a chart contains too many indicators, moving averages and isolated price levels. A fixed range volume profile offers a cleaner starting point because it shows where trading activity was concentrated during a specific period.
However, the tool is only as useful as the range selected. Anchor it to an arbitrary date and the resulting levels may have little relevance. Anchor it to the active market structure and it can quickly reveal the technical premise, including potential support, resistance and fair value.
A supportive fundamental backdrop for the British pound
The starting point for this GBP/USD analysis came from a recent weekly market review by Michael Stark at Exness (thanks, Michael, they are helpfu, keep ’em coming 🙂
Stark highlighted improving sentiment toward the UK political outlook, with markets increasingly expecting policy continuity rather than a sudden change in economic direction. Greater political stability can reduce the risk premium attached to British assets, improve investor confidence and support the pound.
The backdrop is supportive, but not completely one-sided. UK inflation may be slowing, which reduces the urgency for the Bank of England to raise interest rates immediately. The pound will therefore remain sensitive to incoming economic data and changing interest-rate expectations.
For new currency traders, remember that GBP/USD tells us how many US dollars are required to buy one British pound.
- GBP/USD at 1.35 means £1 costs $1.35.
- If the pound strengthens while the dollar remains unchanged, GBP/USD should rise.
- If the US dollar strengthens more quickly than the pound, GBP/USD can fall even when UK news is reasonably positive.
That last point is important. Every currency pair reflects the relative strength of two currencies, not the outlook for only one economy.
What is a fixed range volume profile?
A conventional volume indicator shows how much trading occurred during each candle or period.
A volume profile reorganises that information by price. It shows where the greatest amount of trading took place within the selected range.
The three main references are:
Point of control, or POC
The POC is the price at which the largest amount of volume was transacted during the selected period. It can be viewed as the market’s most accepted price, or approximate fair value, for that particular auction.
Value area high, or VAH
The value area high marks the upper boundary of the main value area.
Value area low, or VAL
The value area low marks the lower boundary.
Depending on the platform settings, the value area normally contains approximately 68% to 70% of all volume transacted during the selected period.
These are not guaranteed reversal levels. They are areas where traders can expect decisions, changes in positioning and potentially increased two-way activity.
How to choose the correct anchor
This is the most important part of the process.
Do not automatically begin the profile at the oldest visible candle, the previous calendar year or a random major high. First identify the range in which the market is currently trading.
In the GBP/USD example shown in the video, the broader structure extends roughly from 1.30 to 1.39. The profile is therefore drawn around the price action belonging to that range, rather than from an unrelated move much further back on the chart.
The process is:
- Start on the monthly or weekly chart.
The higher timeframe makes the active range easier to recognise. - Identify the current auction.
Look for the group of candles trading within the same broad price boundaries. - Place the first anchor at the beginning of that structure.
In this example, the selected range begins around 11 April 2025. - Extend the profile through the latest price action.
The current market activity should remain part of the calculation. - Only then move to the daily or intraday chart.
Smaller timeframes can be used for execution, but the broader profile provides the initial map.
This approach helps prevent traders from getting lost in the forest of individual candles.
What the GBP/USD profile currently shows
At the time of the video, GBP/USD was trading near 1.3464, while the fixed range POC was located around 1.34.
That places the pair relatively close to the profile’s fair-value area. Price had previously advanced toward the value area high before pulling back toward the POC.
This produces a more cautious technical premise than simply saying that improving UK sentiment means traders should immediately buy GBP/USD.
The fundamental backdrop may favour sterling, but price is no longer starting from a deeply discounted location. It is trading near an important area of accepted value.
That means traders can monitor how GBP/USD behaves around the POC:
- Holding above or reclaiming the POC would suggest that buyers are continuing to defend the central value area.
- Repeated rejection below the POC would indicate that the market is beginning to accept lower prices.
- A return toward the value area high would test whether the recent bullish move can develop into genuine continuation.
- Acceptance below the main value area would weaken the immediate bullish interpretation and expose lower references within the broader range.
The monthly chart also identifies the 1.30 area as a potentially important longer-term support or price magnet. It is not an immediate target, but it helps define the lower boundary of the larger structure.
Why these levels can influence price
Volume-profile levels matter partly because many professional and systematic traders are watching similar areas.
The exact calculations may differ slightly between TradingView, NinjaTrader and other platforms, but the resulting POC and value-area references are usually close enough to create common areas of interest.
For example, when price reaches an important lower profile level, profitable short sellers may begin covering their positions.
Closing a short requires buying the instrument back. That can temporarily increase buying pressure and contribute to a bounce, even when the broader trend remains bearish.
This does not mean every profile level will reverse the market. It means traders may use those areas to:
- Take partial profits
- Reduce exposure
- Watch for a reversal or continuation pattern
- Place invalidation beyond the level rather than directly on it
- Avoid entering after a move has already become extended
The video explains this practical use of the levels, including how short covering can affect price near an important support area.
Use volume profile as a map, not a complete strategy
A fixed range volume profile can provide a surprisingly useful market overview within a few minutes.
It answers three initial questions:
- Where has the greatest amount of trading occurred?
- Is price currently above, below or inside accepted value?
- Which levels are most likely to become decision areas?
It does not answer everything.
Traders still need to assess trend, volatility, economic events and the behaviour of the second currency in the pair. They may also use smaller timeframes to look for confirmation before entering a position.
In the current GBP/USD example, improving UK political sentiment provides a constructive backdrop for sterling. The volume profile, however, suggests that traders should still pay close attention to the reaction around the POC rather than automatically chasing the pound after its recent rise.
The objective is not to predict every candle. It is to turn a complicated chart into a structured map of value, acceptance and potential support or resistance.
This article is for educational purposes only and is not financial advice. Trading involves risk. Conduct your own research and manage risk appropriately.
Frequently asked questions for traders, investors and beginner through advanced chartists
What is a fixed range volume profile?
A fixed range volume profile shows how much trading activity occurred at each price within a selected period. Unlike a conventional volume indicator, which displays volume by time, it helps traders identify fair value, potential support, resistance and important decision areas by price.
How do I anchor a fixed range volume profile correctly?
Begin by identifying the active market structure on a weekly or monthly chart. Place the first anchor at the start of the current trading range, then extend the profile through the latest price action. Avoid anchoring it to an arbitrary date or an unrelated historical high or low.
Where was the GBP/USD volume profile anchored in this analysis?
The profile began around 11 April 2025, near the start of the broader structure currently being analysed. That structure extends approximately from 1.30 to 1.39.
What is the point of control in volume profile analysis?
The point of control, or POC, is the price where the greatest amount of volume was transacted during the selected range. It represents an approximate fair-value or acceptance level for that particular market structure.
What do value area high and value area low mean?
Value area high, or VAH, marks the upper boundary of the main value area. Value area low, or VAL, marks its lower boundary. Together, the value area usually contains approximately 68% to 70% of the volume traded during the selected period.
What does the GBP/USD volume profile currently suggest?
At the time of the analysis, GBP/USD was trading near 1.3464, relatively close to the profile’s POC around 1.34. This suggests that the pair was near an important area of accepted value rather than at a deeply discounted price. The reaction around the POC may help indicate whether buyers remain in control or lower prices are gaining acceptance.
Is the GBP/USD outlook bullish?
Improving UK political sentiment provides a constructive backdrop for the British pound. However, the technical outlook remains conditional. Holding above or reclaiming the POC would support the bullish case, while repeated rejection below it would suggest weakening demand and possible acceptance at lower prices.
Are volume-profile levels guaranteed to reverse price?
No. POC, VAH and VAL are decision areas, not guaranteed reversal points. Traders can watch them for evidence of acceptance, rejection, continuation or reversal, while also considering trend, volatility, economic events and risk management.
Why can price react around volume-profile levels?
Many discretionary, professional and systematic traders monitor similar areas. Price may also react because existing traders adjust their positions there. For example, short sellers covering profitable positions near support must buy the currency pair back, potentially contributing to a temporary bounce.
Which timeframe should beginners use?
Start with the monthly or weekly chart to identify and anchor the broader structure. Once the profile is established, move to the daily or intraday chart to study price behaviour and possible execution opportunities.
Can a fixed range volume profile be used as a complete trading strategy?
No. It is best treated as a market map. It can show where value developed and where important decisions may occur, but traders should also assess trend, volatility, upcoming economic data, the relative strength of both currencies and confirmation from price action.
Why does the US dollar matter when analysing GBP/USD?
GBP/USD reflects the relative strength of the British poh1 data-section-id=”1d83fhm” data-start=”0″ data-end=”86″ class=”PDq2pG_selectionAnchorContainer”>GBP/USD technical analysis for beginners: How to anchor a fixed range volume profile
TradingView’s fixed range volume profile can quickly reveal where buyers and sellers have conducted the most business. The difficult part is not adding the tool. It is choosing the right range to analyse.
Technical analysis can become confusing when a chart contains too many indicators, moving averages and isolated price levels. A fixed range volume profile offers a cleaner starting point because it shows where trading activity was concentrated during a specific period.
However, the tool is only as useful as the range selected. Anchor it to an arbitrary date and the resulting levels may have little relevance. Anchor it to the active market structure and it can quickly reveal the technical premise, including potential support, resistance and fair value.
A supportive fundamental backdrop for the British pound
The starting point for this GBP/USD analysis came from a recent weekly market review by Michael Stark at Exness (thanks, Michael, they are helpfu, keep ’em coming 🙂
Stark highlighted improving sentiment toward the UK political outlook, with markets increasingly expecting policy continuity rather than a sudden change in economic direction. Greater political stability can reduce the risk premium attached to British assets, improve investor confidence and support the pound.
The backdrop is supportive, but not completely one-sided. UK inflation may be slowing, which reduces the urgency for the Bank of England to raise interest rates immediately. The pound will therefore remain sensitive to incoming economic data and changing interest-rate expectations.
For new currency traders, remember that GBP/USD tells us how many US dollars are required to buy one British pound.
- GBP/USD at 1.35 means £1 costs $1.35.
- If the pound strengthens while the dollar remains unchanged, GBP/USD should rise.
- If the US dollar strengthens more quickly than the pound, GBP/USD can fall even when UK news is reasonably positive.
That last point is important. Every currency pair reflects the relative strength of two currencies, not the outlook for only one economy.
What is a fixed range volume profile?
A conventional volume indicator shows how much trading occurred during each candle or period.
A volume profile reorganises that information by price. It shows where the greatest amount of trading took place within the selected range.
The three main references are:
Point of control, or POC
The POC is the price at which the largest amount of volume was transacted during the selected period. It can be viewed as the market’s most accepted price, or approximate fair value, for that particular auction.
Value area high, or VAH
The value area high marks the upper boundary of the main value area.
Value area low, or VAL
The value area low marks the lower boundary.
Depending on the platform settings, the value area normally contains approximately 68% to 70% of all volume transacted during the selected period.
These are not guaranteed reversal levels. They are areas where traders can expect decisions, changes in positioning and potentially increased two-way activity.
How to choose the correct anchor
This is the most important part of the process.
Do not automatically begin the profile at the oldest visible candle, the previous calendar year or a random major high. First identify the range in which the market is currently trading.
In the GBP/USD example shown in the video, the broader structure extends roughly from 1.30 to 1.39. The profile is therefore drawn around the price action belonging to that range, rather than from an unrelated move much further back on the chart.
The process is:
- Start on the monthly or weekly chart.
The higher timeframe makes the active range easier to recognise. - Identify the current auction.
Look for the group of candles trading within the same broad price boundaries. - Place the first anchor at the beginning of that structure.
In this example, the selected range begins around 11 April 2025. - Extend the profile through the latest price action.
The current market activity should remain part of the calculation. - Only then move to the daily or intraday chart.
Smaller timeframes can be used for execution, but the broader profile provides the initial map.
This approach helps prevent traders from getting lost in the forest of individual candles.
What the GBP/USD profile currently shows
At the time of the video, GBP/USD was trading near 1.3464, while the fixed range POC was located around 1.34.
That places the pair relatively close to the profile’s fair-value area. Price had previously advanced toward the value area high before pulling back toward the POC.
This produces a more cautious technical premise than simply saying that improving UK sentiment means traders should immediately buy GBP/USD.
The fundamental backdrop may favour sterling, but price is no longer starting from a deeply discounted location. It is trading near an important area of accepted value.
That means traders can monitor how GBP/USD behaves around the POC:
- Holding above or reclaiming the POC would suggest that buyers are continuing to defend the central value area.
- Repeated rejection below the POC would indicate that the market is beginning to accept lower prices.
- A return toward the value area high would test whether the recent bullish move can develop into genuine continuation.
- Acceptance below the main value area would weaken the immediate bullish interpretation and expose lower references within the broader range.
The monthly chart also identifies the 1.30 area as a potentially important longer-term support or price magnet. It is not an immediate target, but it helps define the lower boundary of the larger structure.
Why these levels can influence price
Volume-profile levels matter partly because many professional and systematic traders are watching similar areas.
The exact calculations may differ slightly between TradingView, NinjaTrader and other platforms, but the resulting POC and value-area references are usually close enough to create common areas of interest.
For example, when price reaches an important lower profile level, profitable short sellers may begin covering their positions.
Closing a short requires buying the instrument back. That can temporarily increase buying pressure and contribute to a bounce, even when the broader trend remains bearish.
This does not mean every profile level will reverse the market. It means traders may use those areas to:
- Take partial profits
- Reduce exposure
- Watch for a reversal or continuation pattern
- Place invalidation beyond the level rather than directly on it
- Avoid entering after a move has already become extended
The video explains this practical use of the levels, including how short covering can affect price near an important support area.
Use volume profile as a map, not a complete strategy
A fixed range volume profile can provide a surprisingly useful market overview within a few minutes.
It answers three initial questions:
- Where has the greatest amount of trading occurred?
- Is price currently above, below or inside accepted value?
- Which levels are most likely to become decision areas?
It does not answer everything.
Traders still need to assess trend, volatility, economic events and the behaviour of the second currency in the pair. They may also use smaller timeframes to look for confirmation before entering a position.
In the current GBP/USD example, improving UK political sentiment provides a constructive backdrop for sterling. The volume profile, however, suggests that traders should still pay close attention to the reaction around the POC rather than automatically chasing the pound after its recent rise.
The objective is not to predict every candle. It is to turn a complicated chart into a structured map of value, acceptance and potential support or resistance.
This article is for educational purposes only and is not financial advice. Trading involves risk. Conduct your own research and manage risk appropriately.
Frequently asked questions for traders, investors and beginner through advanced chartists
What is a fixed range volume profile?
A fixed range volume profile shows how much trading activity occurred at each price within a selected period. Unlike a conventional volume indicator, which displays volume by time, it helps traders identify fair value, potential support, resistance and important decision areas by price.
How do I anchor a fixed range volume profile correctly?
Begin by identifying the active market structure on a weekly or monthly chart. Place the first anchor at the start of the current trading range, then extend the profile through the latest price action. Avoid anchoring it to an arbitrary date or an unrelated historical high or low.
Where was the GBP/USD volume profile anchored in this analysis?
The profile began around 11 April 2025, near the start of the broader structure currently being analysed. That structure extends approximately from 1.30 to 1.39.
What is the point of control in volume profile analysis?
The point of control, or POC, is the price where the greatest amount of volume was transacted during the selected range. It represents an approximate fair-value or acceptance level for that particular market structure.
What do value area high and value area low mean?
Value area high, or VAH, marks the upper boundary of the main value area. Value area low, or VAL, marks its lower boundary. Together, the value area usually contains approximately 68% to 70% of the volume traded during the selected period.
What does the GBP/USD volume profile currently suggest?
At the time of the analysis, GBP/USD was trading near 1.3464, relatively close to the profile’s POC around 1.34. This suggests that the pair was near an important area of accepted value rather than at a deeply discounted price. The reaction around the POC may help indicate whether buyers remain in control or lower prices are gaining acceptance.
Is the GBP/USD outlook bullish?
Improving UK political sentiment provides a constructive backdrop for the British pound. However, the technical outlook remains conditional. Holding above or reclaiming the POC would support the bullish case, while repeated rejection below it would suggest weakening demand and possible acceptance at lower prices.
Are volume-profile levels guaranteed to reverse price?
No. POC, VAH and VAL are decision areas, not guaranteed reversal points. Traders can watch them for evidence of acceptance, rejection, continuation or reversal, while also considering trend, volatility, economic events and risk management.
Why can price react around volume-profile levels?
Many discretionary, professional and systematic traders monitor similar areas. Price may also react because existing traders adjust their positions there. For example, short sellers covering profitable positions near support must buy the currency pair back, potentially contributing to a temporary bounce.
Which timeframe should beginners use?
Start with the monthly or weekly chart to identify and anchor the broader structure. Once the profile is established, move to the daily or intraday chart to study price behaviour and possible execution opportunities.
Can a fixed range volume profile be used as a complete trading strategy?
No. It is best treated as a market map. It can show where value developed and where important decisions may occur, but traders should also assess trend, volatility, upcoming economic data, the relative strength of both currencies and confirmation from price action.
Why does the US dollar matter when analysing GBP/USD?
GBP/USD reflects the relative strength of the British pound and the US dollar. Positive UK news does not guarantee that the pair will rise. If the dollar strengthens more quickly than sterling, GBP/USD can still decline.