Fundamental
Overview
The USD got a boost from
the strong US Consumer Confidence data which triggered an aggressive
rise in long term Treasury yields. The report however just showed that the
labour market remains resilient which is good news for growth and not
necessarily bad news for inflation. The greenback benefited also from the
risk-off sentiment which seems to be caused more by the month-end flows rather
than a fundamental driver.
The GBP, on the other hand,
has been supported by a slightly more hawkish repricing in interest rates
expectations following the hot UK CPI report last week which saw the chances of a
rate cut in June evaporating. If we go back into risk-on sentiment, the
greenback could start losing ground against the Pound again.
GBPUSD
Technical Analysis – Daily Timeframe
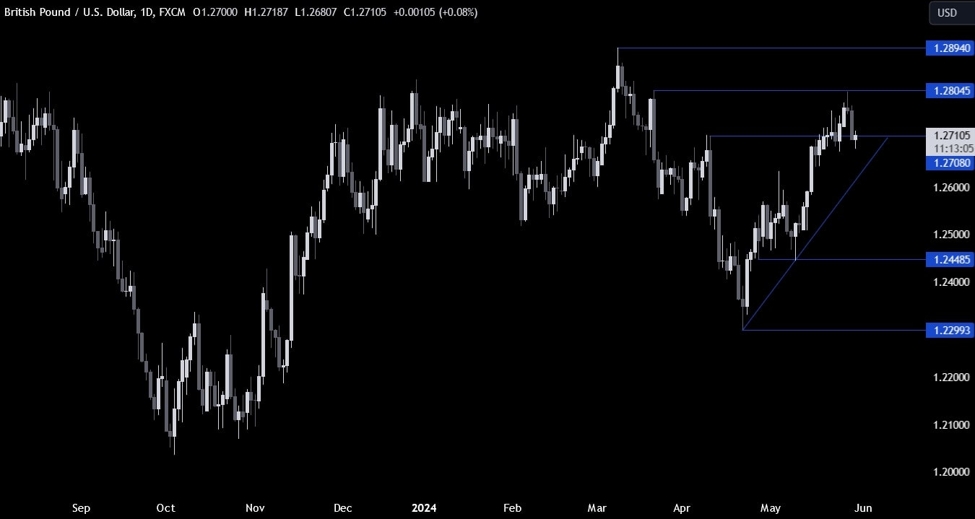
GBPUSD Daily
On the daily chart, we can
see that GBPUSD managed to eventually hit the 1.28 handle. The pair started to
drop steadily since then as the risk-off sentiment in the markets boosted the
US Dollar. If the correction extends further, we can expect the buyers to lean
on the trendline
around the 1.2630 level to position for a rally into new highs with a good risk
to reward setup.
The sellers, on the other hand, will want to see the price
breaking lower to invalidate the bullish setup and position for a drop into the
1.25 handle next.
GBPUSD Technical
Analysis – 4 hour Timeframe
GBPUSD 4 hour
On the 4 hour chart, we can
see that we have the confluence of the previous swing high and the
50.0% Fibonacci retracement level around the trendline. This
should technically strengthen the support and give the buyers a bit more
conviction for a bounce. A break below that support
should give the sellers more control and increase the bearish momentum.
GBPUSD Technical
Analysis – 1 hour Timeframe
GBPUSD 1 hour
On the 1 hour chart, we can
see that we have a good resistance at the 1.2710 level where we can find the
confluence of the downward minor trendline and the 38.2% Fibonacci retracement
level.
This is where we can expect the sellers to step in with a defined risk
above the trendline to position for a drop into the major trendline with a good
risk to reward setup. The buyers, on the other hand, will want to see the price
breaking higher to invalidate the bearish setup and start targeting new highs.
Upcoming
Catalysts
Today we will see the latest US Jobless Claims figures, while tomorrow we
conclude the week with the US PCE report.