Fundamental
Overview
The USD weakened across the
board last Friday following the soft US NFP
report. The data showed some more labour market cooling with an increase in the
unemployment rate and a decrease in wage growth. We basically have an economy
that is slowing but still growing.
We will
see if the market will be able to keep the positive sentiment on soft landing
hopes or start to worry about a recession. Yesterday, Fed Chair Powell testified to Congress but he didn’t offer anything in terms of forward
guidance as they want to see more data before signalling any action.
The GBP, on the other hand,
gained last week against the US Dollar mainly because of the risk-on sentiment
as the US data continued to support at least two rate cuts from the Fed but
didn’t send recessionary signals. This week, we are seeing a consolidation as
the market awaits the US CPI and Jobless Claims figures tomorrow.
On the monetary policy
front, the BoE
in June left the door open for a rate cut in August with the market probability
standing at 60%. The next UK CPI report on July 17th will likely
decide whether the central bank will be able to deliver the first cut in August
or wait some more time.
GBPUSD
Technical Analysis – Daily Timeframe
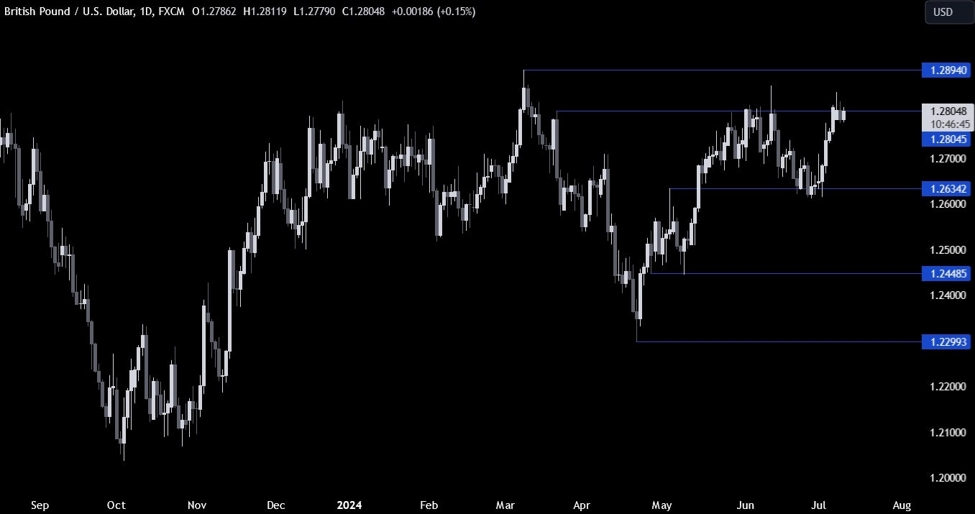
GBPUSD Daily
On the daily chart, we can
see that GBPUSD is struggling around the 1.28 resistance as the market awaits the release of
the US CPI and Jobless Claims figures tomorrow. This is where the sellers
continue to step in with a defined risk above the resistance to position for a
drop back into the 1.2635 support. The buyers, on the other hand, will want to
see the price breaking higher to increase the bullish bets into the 1.29 handle
next.
GBPUSD Technical
Analysis – 4 hour Timeframe
GBPUSD 4 hour
On the 4 hour chart, we can
see that from a risk management perspective, the buyers will have a better risk
to reward setup around the 1.2750 level where we can find the confluence
of the previous swing level and the 38.2% Fibonacci
retracement level. The sellers, on the other hand, will want to see the
price breaking lower to increase the bearish bets into the 1.2635 support.
GBPUSD Technical
Analysis – 1 hour Timeframe
GBPUSD 1 hour
On the 1 hour chart, we are
seeing some pickup in bullish momentum today although the buyers will want to
see the price breaking above the most recent lower high at 1.2825 before piling
in with more conviction. On the other hand, a break below the minor counter-trendline
might lead to an increase in the bearish momentum and provide the correction
into the 1.2750 level. The red lines define the average daily range for today.
Upcoming
Catalysts
Tomorrow will be the most important day of the week as we get the US CPI and the
US Jobless Claims figures. On Friday, we conclude the week with the US PPI and
the University of Michigan Consumer Sentiment survey.