The GBPUSD is waking up and trying to take more control with a push to the upside, but there is work to be done.
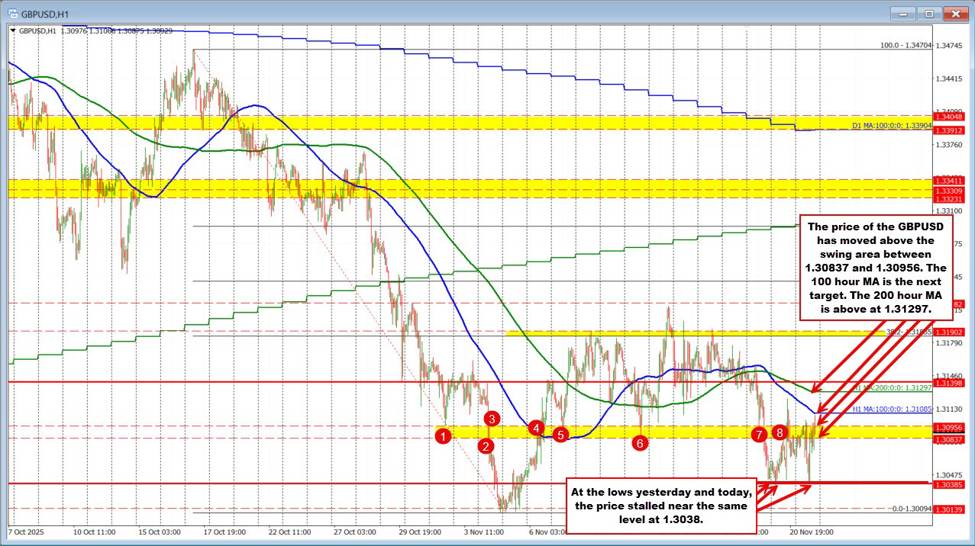
Looking at the hourly chart of the GBPUSD, the pair has been battling back and forth, trying to find a direction. We established a nice double bottom floor at the 1.3038 level—holding yesterday and testing it again today before rotating higher. That level is now the definitive line in the sand for the sellers; as long as we stay above that, the wash-out remains on hold.
For the last several sessions, the price has been capped by a sticky “swing area” between 1.30837 and 1.30956 (highlighted in yellow – s red numbered circlesee ). You can see on the chart (Red circles 1 through 8) how many times price interacted with this zone—acting as both support and resistance.
The price has now broken above that swing area. Buyers are making a play.
However, for the buyers to keep “winning,” they need to turn that old ceiling into a new floor. Staying above 1.30837 is close support now.
On the topside, the next target comes against the 100 hour moving average (blue line at 1.31085). So far the price has stalled against that level keeping the sellers “in play” and in more control.
Getting above the 100 hour moving average would have traders next targeting the 200 hour moving average. That level comes in at 1.31297
Ultimately, if the buyers are to take more control, they need to get above both those moving averages and stay above those moving averages. So far, the sellers are leaning against the 100 hour MA.