Funtap
Gen Digital Inc. (NASDAQ:GEN) is a systems software company that offers a wide range of cybersecurity and antivirus products and services, including those from Norton, Avast, LifeLock, Avira, AVG, ReputationDefender, and CCleaner, following the merger of NortonLifeLock and Avast in 2022. In our, previous analysis of GEN, we expected the merger between NortonLifeLock and Avast to create significant revenue and cost synergies as well as boost its market share in consumer security market to 42.6%. However, margins fell short of our expectations post-acquisition with operating margins of 31% in 2023 against a forecast of 49.5%.
Despite the company’s revenue growth increasing over the past five years following a series of M&A activities, its cash and cash equivalents have declined over the same period, dropping from $2.3 bln in 2019 to $0.8 bln in 2023. In contrast, its debt (total debt excluding account payables) has risen by $5.8 bln during the same period from $7.6 bln to $13.5 bln.
Company Data, Khaveen Investments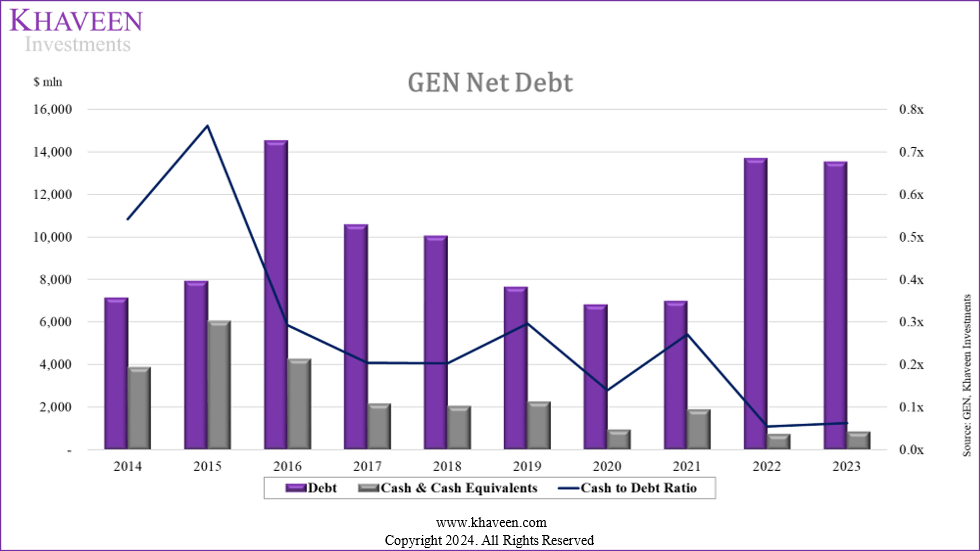
We proceeded to compile the cash-to-debt ratio from Gen Digital and its peers for the past five years. We can see that the trend of lower Cash-to-debt ratios is market-wide.
Company Data, Khaveen Investments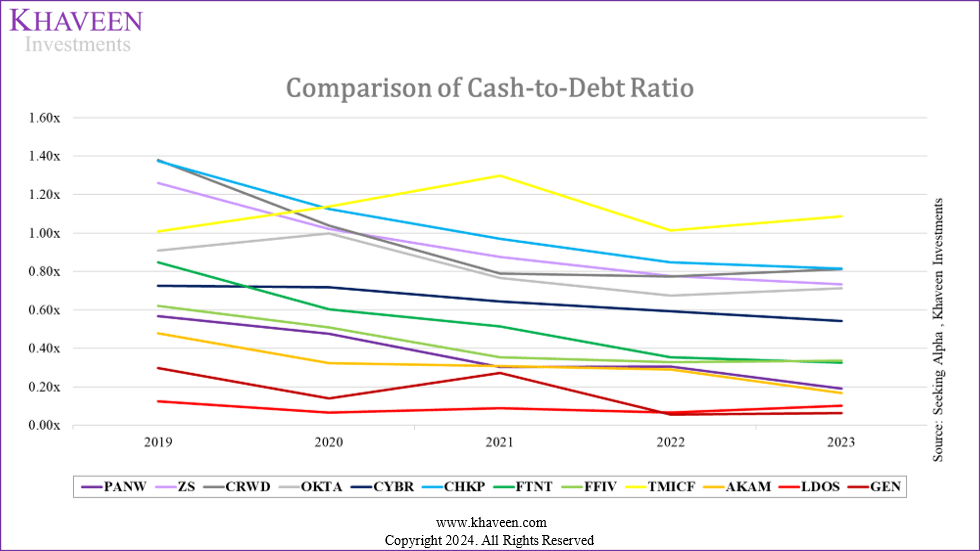
|
5Y Cash-to-Debt Ratio Comparison |
2019 |
2020 |
2021 |
2022 |
2023 |
Average |
|
GEN |
0.30x |
0.14x |
0.27x |
0.05x |
0.06x |
0.16x |
|
Industry Average |
1.26x |
0.77x |
0.64x |
0.53x |
0.52x |
0.75x |
Source: Company Data, Khaveen Investments
Both the market average and the company saw downward trends in cash-to-debt ratios, with the market average cash-to-debt ratio standing at 0.52x. In comparison though, Gen Digital’s cash-to-debt ratio in 2023 stood at 0.06x, the lowest among its peers. Hence, we believe that while this trend is market-wide, Gen Digital is relatively weaker than its peers. To understand the reasons behind this we had to analyze the company’s earnings and cash flows which was not simple, as the company’s cash flows have fluctuated significantly over the past seven years, with its free cash flow margin ranging from -164.3% to 426.1%. Hence, we broke down the company’s financials to understand how the company got to its current financial position, and then forecasted the company’s forward financials including its debt and cash balances to estimate how the company’s financial position would change moving forward.
Income Statement Analysis
As seen below, the company’s margins have fluctuated wildly over the past decade. We believe this is due to the high amount of M&A activity and restructuring that the company has undertaken during this period.
Company Data, Khaveen Investments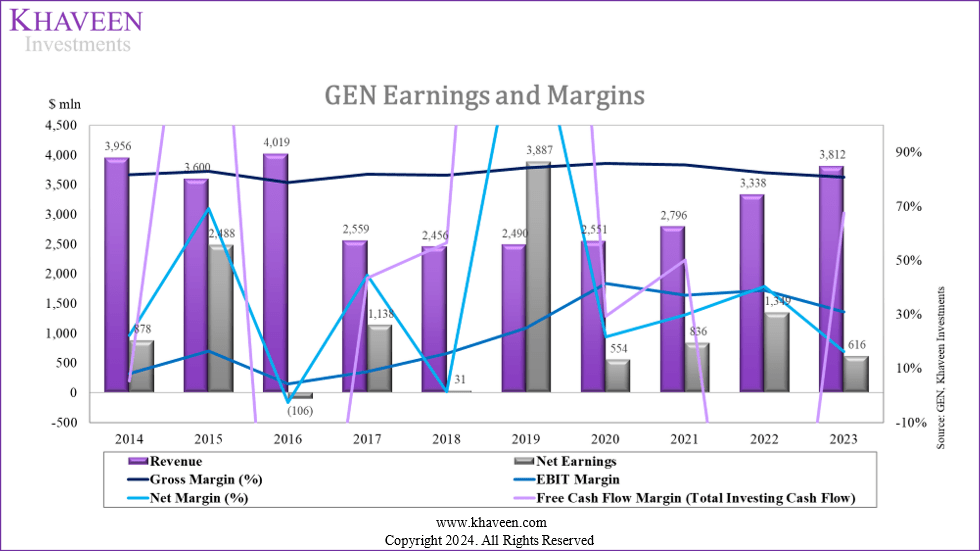
|
GEN Profitability Margins |
2017 |
2018 |
2019 |
2020 |
2021 |
2022 |
2023 |
Average |
|
Revenue Growth (%) |
-36.33% |
-4.03% |
1.38% |
2.45% |
9.60% |
19.38% |
14.20% |
0.95% |
|
Gross Margin (%) |
81.91% |
81.47% |
84.22% |
85.81% |
85.41% |
82.35% |
80.82% |
83.14% |
|
EBITDA Margin (%) |
18.17% |
24.27% |
32.97% |
46.14% |
40.67% |
44.61% |
37.64% |
34.92% |
|
EBIT Margin (%) |
8.83% |
15.43% |
24.90% |
41.47% |
37.05% |
38.83% |
30.93% |
28.21% |
|
EBT Margin (%) |
9.53% |
-4.36% |
32.89% |
34.18% |
37.27% |
24.09% |
12.04% |
20.81% |
|
Net Margin (%) |
-36.33% |
-4.03% |
1.38% |
2.45% |
9.60% |
19.38% |
14.20% |
44.29% |
Source: Company Data, Khaveen Investments
Revenue Growth
Starting with revenue growth, the company has experienced fluctuations from -36% to 19%. The company’s huge decline in revenue in 2017 can be attributed to the divestment of Veritas, its information management business. On the other end, we looked into Gen Digital’s annual reports for the past three years to identify the reason for the growth surge in recent years. Management attributes the primary contributor to revenue was due to acquisitions, namely the Avast acquisition for 2023 and 2022, and the Avira acquisition for 2021.
Meanwhile, analyst consensus expects a five-year forward growth rate of 2.43%, which we believe is appropriate given the lack of revenue growth from further acquisitions moving forward.
Seeking Alpha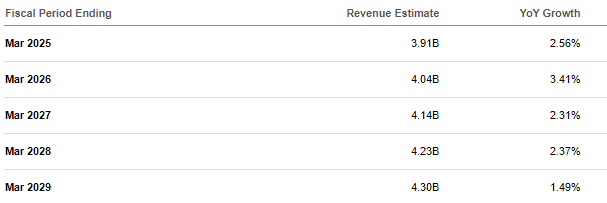
The only consistent margin was the gross margin which averaged 83.1% over the past seven years. The company’s EBIT margin increased from 8.8% in 2017 to 41.5% in 2020, but has since declined to 30.9%. We identified that the company’s R&D expense margin has actually decreased consistently over the past seven years. Meanwhile, the company’s SG&A expense margin has also decreased till 2020 before rising slightly again.
|
GEN EBITDA Margin |
2017 |
2018 |
2019 |
2020 |
2021 |
2022 |
2023 |
Average |
|
Earnings Before Interest & Taxes (EBIT) |
8.83% |
15.43% |
24.90% |
41.47% |
37.05% |
38.83% |
30.93% |
28.21% |
|
Amortization of Intangibles |
3.40% |
3.30% |
3.20% |
2.90% |
3.00% |
5.20% |
6.10% |
3.90% |
|
D&A of PPE |
9.34% |
8.84% |
8.07% |
4.66% |
3.61% |
5.78% |
6.72% |
6.72% |
|
EBITDA Margin |
21.57% |
27.53% |
36.18% |
49.00% |
43.71% |
49.76% |
43.75% |
38.78% |
Source: Company Data, Khaveen Investments
We identified that the company classifies its Depreciation & Amortization of its Property, Plant & Equipment under its COGS, while classifying its amortization of intangible assets under its Other Expenses. While D&A decreased over this period, Amortization of intangibles increased. The company also provided its future amortization table which we use in our forecasts.
EBT Margin
|
GEN EBT Margin |
2017 |
2018 |
2019 |
2020 |
2021 |
2022 |
2023 |
Average |
|
Earnings Before Interest & Taxes (EBIT) |
8.83% |
15.43% |
24.90% |
41.47% |
37.05% |
38.83% |
30.93% |
28.21% |
|
Interest Expense |
10.00% |
8.50% |
7.90% |
5.60% |
4.50% |
12.00% |
17.50% |
9.40% |
|
Interest Income |
0.90% |
1.70% |
3.20% |
0.20% |
0.00% |
0.40% |
0.70% |
1.00% |
|
Net Margin (%) |
9.53% |
-4.36% |
32.89% |
34.18% |
37.27% |
24.09% |
12.04% |
20.81% |
Source: Company Data, Khaveen Investments
The company’s interest expense experienced a decreasing trend from 2017 to 2021 (from $256 mln to $126 mln) but significantly increased in 2022 ($401 mln) and continued to increase in 2023 ($669 mln). We believe the decline in interest expense in those years was attributed to the decline in total debt from debt repayment, while the surge in the interest expense was due to debt issuance of $5.9 bln. Moreover, interest income is lower than interest expense throughout the period, with a slight increase in 2022 and 2023, leading to net interest expense mainly contributed by interest expense.
When examining the interest expense/income as % of revenue, we observed a similar trend in the interest expense and net interest expense margins increasing substantially from 2022, equivalent to 12% and 11.6% of revenue. The margins continued to increase in 2023 to 17.5% and 16.9%, respectively, indicating higher net interest expense relative to revenue. In contrast, interest income percentages are relatively low throughout the period, with minor fluctuations.
|
Interest Expense Analysis (% of Debt) |
2017 |
2018 |
2019 |
2020 |
2021 |
2022 |
2023 |
Average |
|
Interest Expense |
2.4% |
2.1% |
2.6% |
2.1% |
1.8% |
2.9% |
5.0% |
2.7% |
|
Net Interest Expense |
2.2% |
1.7% |
1.5% |
2.1% |
1.8% |
2.8% |
4.8% |
2.4% |
Source: Company Data, Khaveen Investments
Examining the interest expense as % of debt, the percentages are relatively stable over the years, with a slight increase in 2023 to 5%. Similarly, net interest expense as % of debt also showed a surge in 2023 to 4.8%, indicating higher net interest expenses paid in relation to total debt compared to previous years. We believe it could be due to higher interest rates from the newly issued debt as the US Federal interest rate has also risen from around 1% in 2017 to 5.25% in 2023.
Federal Reserve Bank of New York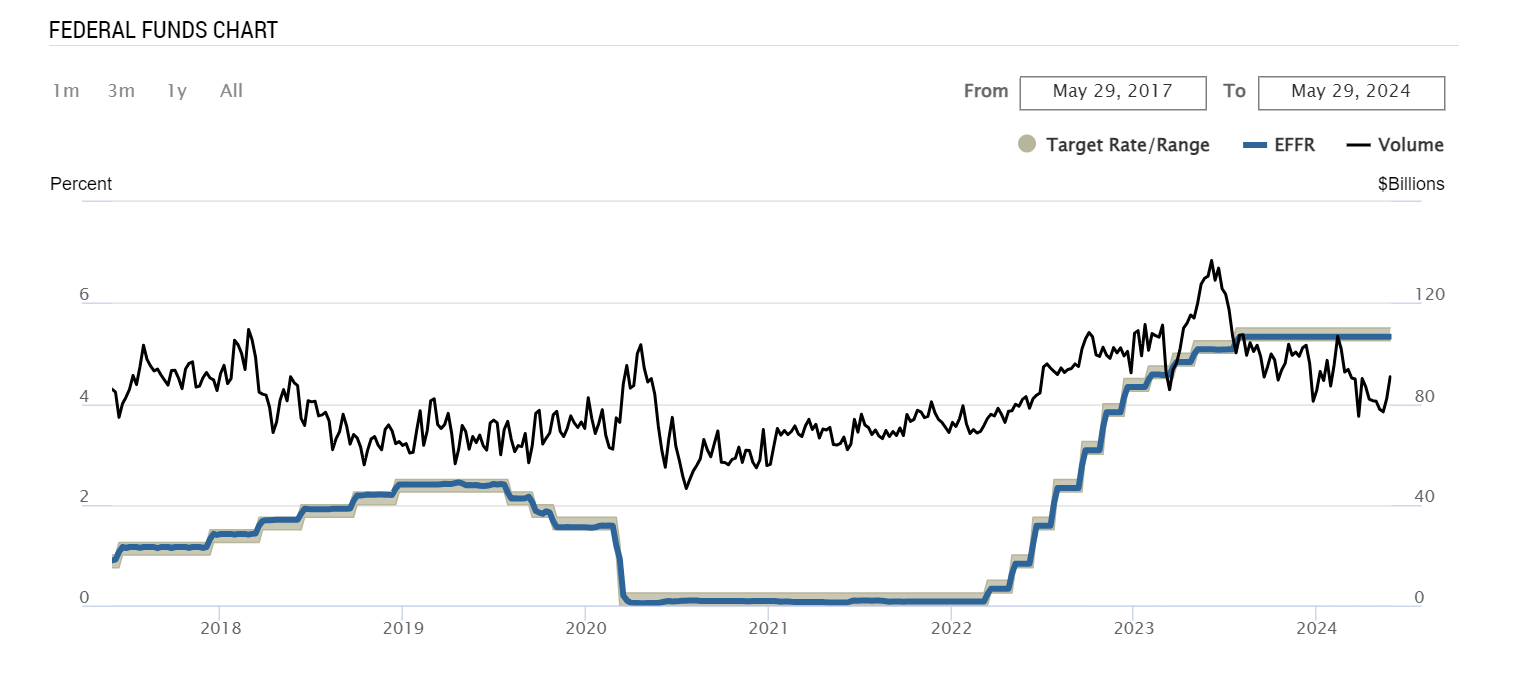
Net Margin
In normal cases, when the business generates positive taxable income, it will be taxed by a certain percentage of earnings before tax (“EBT”). However, if the business reports a loss (negative EBT) in a particular year, then it could file a negative income tax for that year and “carry the loss forward or backward to offset the positive taxable income for the other years, which will lower the tax liability for those years.”
While the company’s tax expenses followed the normal case for 2019 to 2021, where it paid income tax on EBT, it also received tax benefits even in the years it generated positive EBT (2017, 2022, and 2023) and paid income tax in the year it generated negative EBT (2018). After adjusting for tax expenses or benefits, the result was earnings from continuing operations, while earnings from discontinued operations were reported net of taxes.
|
GEN Net Margin and Tax Analysis |
2017 |
2018 |
2019 |
2020 |
2021 |
2022 |
2023 |
Average (7-year) |
|
EBT Margin |
9.53% |
-4.36% |
32.89% |
34.18% |
37.27% |
24.09% |
12.04% |
20.81% |
|
Earnings Before Tax ($ mln) |
244 |
-107 |
819 |
872 |
1,042 |
804 |
459 |
590 |
|
Tax Expense ($ mln) |
-720 |
3 |
241 |
176 |
206 |
-545 |
-157 |
-114 |
|
Tax as % of Revenue (%) |
-28.10% |
0.10% |
9.70% |
6.90% |
7.40% |
-16.30% |
-4.10% |
-3.50% |
|
Tax as % of EBT (%) |
-295.10% |
-2.80% |
29.40% |
20.20% |
19.80% |
-67.80% |
-34.20% |
-47.20% |
|
Tax as % of Earnings from Continuing Operations (%) |
-74.70% |
-2.70% |
41.70% |
25.30% |
24.60% |
-40.40% |
-25.50% |
-7.40% |
|
Net Margin |
44.47% |
1.26% |
156.10% |
21.72% |
29.90% |
40.41% |
16.16% |
44.29% |
Source: Company Data, Khaveen Investments
From the table above, Gen Digital’s average tax expense (benefit) as a percentage of revenue was -3.5% over the past seven years, indicating that the company received tax refunds amounting to 3.5% of its revenue annually. In addition, the amount was equal to 7.4% of average earnings from continuing operations during the same period. In particular, the tax received in the past two years was significant, accounting for 40.4% and 25.5% of Earnings from Continuing Operations, respectively. While the company’s average effective tax rate during 2019-2021 of 23.1% was relatively in line with the corporate tax rate of 21%, it dropped to negative 67.8% in 2022 and slightly increased back in 2023 to -34.2%. Overall, with the tax received in 2017, 2022, and 2023, its average tax rate was negative 47.2%, offsetting any tax expense in between.
Therefore, we believe these tax benefits are influenced by other factors. On that note, management mentioned in the latest earnings briefing that it received a $900 mln tax refund in 2023, which prompted us to look at the reason for gaining this tax benefit and whether the company could continue to benefit from it. We compiled the breakdown of the company’s effective tax over the past seven years. As there were various inconsistent tax items disclosed in the annual reports, we grouped those based on their characteristics and impact on tax expense/benefit:
- Tax directly related to earnings (Federal Statutory tax expense (benefit), state taxes or net of federal benefit, foreign earnings taxed at other than the federal rate, US Tax on foreign earnings)
- Tax related to changes in legislation (Transition Tax, Reassessment of deferred taxes on foreign earnings, effect of tax rate change on deferred tax, favorable ruling on foreign withholding tax)
- Specific Expenses Adjustments (Nondeductible expenses, nondeductible goodwill, stock-based compensation)
- Adjustments and Reconciliation of Tax Position (Valuation allowance increase (decrease), change in uncertain tax positions, change in unrecognized tax benefits, return to provision adjustment)
- Expense (benefit) related to Avast merger (Capital loss, legal entity restructuring)
- Others (Federal R&D credit, tax interest and penalties, foreign exchange loss (gain), Other or net)
|
Effective Tax Breakdown (%) |
2017 |
2018 |
2019 |
2020 |
2021 |
2022 |
2023 |
Total |
|
Tax directly related to earnings |
13% |
-1967% |
78% |
104% |
105% |
-31% |
-60% |
-88% |
|
Tax related to changes in legislation |
91% |
-67% |
0% |
-20% |
0% |
0% |
0% |
87% |
|
Specific expenses adjustments |
-5% |
267% |
10% |
3% |
3% |
-5% |
-41% |
-22% |
|
Adjustments and Reconciliation of Tax Position |
-1% |
1800% |
6% |
3% |
-4% |
-24% |
-213% |
-67% |
|
Expense (Benefit) related to Avast merger |
0% |
0% |
0% |
0% |
0% |
159% |
486% |
205% |
|
Others |
2% |
67% |
6% |
10% |
-5% |
1% |
-72% |
-15% |
|
Income tax expense (benefit) (%) |
100% |
100% |
100% |
100% |
100% |
100% |
100% |
100% |
|
Income tax expense (benefit) ($ mln) |
(720) |
3 |
241 |
176 |
206 |
(545) |
(157) |
(796) |
Source: Company Data, Khaveen Investments
The table shows the breakdown of the difference between federal statutory income tax and the company’s effective income, in which the signs of each breakdown are directly proportionate to the value of the tax paid or received by the company. From the table, the actual tax total directly related to net earnings contributed -88% of the company’s total income tax received of $796 mln over the past seven years, indicating that the company paid tax ($703 mln) in accordance with the annual EBT it generated. Similarly, Adjustments and Reconciliation of Tax Position’s contribution was -67% but was mostly offset by the benefit related to the Avast merger, which accounted for 205% of the total income tax received.
Furthermore, we identified that the company received significant tax benefits in 2017, 2022, and 2023 that helped offset tax expenses during 2018-2021. In particular, the tax benefit in 2017 was mostly under tax related to changes in legislation (91%) and a small portion came from tax related to earnings (13%). In 2017, the US government signed the Tax Act to reduce the corporate tax rate to 21% from 35%, and this Act adopted a territorial tax system, indicating that US companies would no longer be taxed on most of their foreign earnings. Thus, there was an income tax benefit of $1,552 mln recognized due to this reassessment of deferred tax on foreign earnings and the effect of tax rate change. Additionally, the company paid out $893 mln for a “one-time Transition tax” based on its “total post-1986 earnings and profits (“E&P”) that we previously deferred from U.S. income taxes”. All of these items were grouped under the related changes in legislation, which resulted in the total tax received by the company in 2017.
In addition, the tax received related to the merger with Avast contributed 159% and 486% to the total tax received in 2022 and 2023, respectively. According to Gen Digital, it undertook a legal entity restructuring as part of the Avast integration plan in 2022, which resulted in capital losses. The company then carried back these losses to its FY2019 to offset the capital gain that occurred in that year. Hence, there was a $910 mln gain from capital loss in 2022, contributing to the tax benefit of $545 mln overall. Additionally, the company received another $719 mln of tax from Legal entity restructuring, offsetting the tax paid related to net earnings and adjustment of tax position.
There was also a substantial tax paid from adjustments of a tax position in 2022 and 2023, which we identified to be from the change in an unrecognized tax benefit, including payments of $163 mln and $338 mln. Unrecognized tax benefits represent potential tax liabilities arising from uncertain positions. It reflects taxes that might be owed upon resolution of tax audits or disputes, thus the company has to pay additional taxes if certain tax positions are disallowed upon examination by tax authorities.
Thus, excluding one-time tax received or paid out, which were tax-related to changes in legislation in 2017 and benefits related to the Avast merger in 2022 and 2023, we calculated the adjusted income tax expense (benefit) for the company from 2017 to 2023. After adjustment, the company would have paid out $1,491 mln in total, a $2,297 mln decrease from its actual income tax expense (benefit) due to the one-time benefits it received in 2017, 2022, and 2023.
Gen Digital 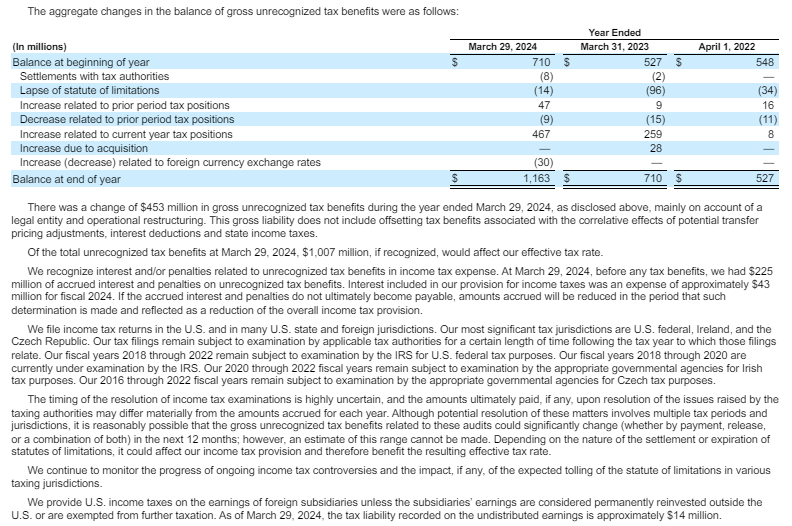
While the company mentioned that the process of recognizing these liabilities would take several years, when it is recognized, the company’s effective tax expense (benefit) would be higher, affecting the company’s net earnings. Based on the examination periods of its unrecognized tax benefit reported in the annual report, we calculated the average duration of these periods and estimated it might take the company seven years to fully recognize the $1,007 mln ($144 mln annually) mentioned in the report. We forecasted the company’s total tax expense based on total tax directly related to earnings, using a seven-year average earning-related tax expense as a % of EBT of 17.8%, and accounted for changes in unrecognized tax benefits of $144 mln annually. After adjusting for all one-off items, the total tax expense is slightly lower than its previous years.
|
Effective Tax Projection ($ mln) |
2024F |
2025F |
2026F |
2027F |
2028F |
|
Tax directly related to earnings |
144 |
151 |
159 |
164 |
168 |
|
Adjustments and Reconciliation of Tax position |
144 |
144 |
144 |
144 |
144 |
|
Total Tax Expense |
287 |
295 |
303 |
308 |
312 |
Source: Company Data, Khaveen Investments
Financial Projections
Company Data, Khaveen Investments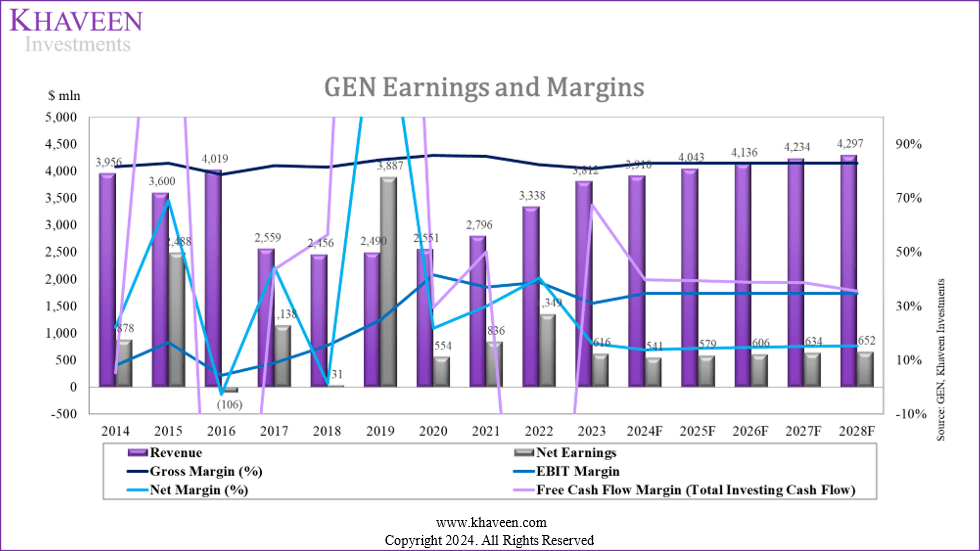
All in all, the chart above shows our modeled projections for the company. Our assumptions included its COGS (11.8%), Depreciation (5.37%), R&D (9%), SG&A (33.5%) and capex (0.3%) % of revenue based on its three-year average which was relatively stable in the period. Furthermore, we based its net interest expenses % debt on its 2023 figure of 4.77% and factored in the company’s amortization of intangible estimates from its annual report. In total, we projected the company’s profitability margins to remain positive with a forward five-year average net margin of 14.59%, though short of our previous forecasts of 43%. Additionally, we forecast its average forward FCF margin of 38.45%. We note the large positive difference between FCF and net margin due to its depreciation and amortization of intangibles expenses which are non-cash expenditures and are included back to operating cash flows, boosting its FCF margins.
Cash Flow Analysis
In this second section, we examine the company’s cash flow to understand the reasons for its declining cash flow over the years by looking closely at each cash flow activity. Subsequently, based on our analysis, we determined whether its cash level could improve.
Operating Cash Flow
|
Cash Flow From Operating Activities ($ mln) |
2017 |
2018 |
2019 |
2020 |
2021 |
2022 |
2023 |
Total from 2017-2023 |
% of Cash from Operations |
|
Net Earnings to Company |
1,138 |
31 |
3,887 |
554 |
836 |
1,349 |
616 |
8,411 |
138.2% |
|
Earnings from Continuing Operations |
964 |
(110) |
578 |
696 |
836 |
1,349 |
616 |
4,929 |
81.0% |
|
Earnings from Discontinued Operations, net of taxes |
174 |
141 |
3,309 |
(142) |
0 |
0 |
0 |
3,482 |
57.2% |
|
Depreciation & Amortization |
239 |
217 |
201 |
119 |
101 |
193 |
256 |
1,326 |
21.8% |
|
Changes in Working Capital |
(172) |
98 |
519 |
(41) |
8 |
(34) |
(6) |
372 |
6.1% |
|
Other Cash Transactions |
(255) |
1,149 |
(5,468) |
74 |
29 |
(751) |
1,198 |
(4,024) |
-66.1% |
|
Cash from Operations |
950 |
1,495 |
(861) |
706 |
974 |
757 |
2,064 |
6,085 |
100% |
Source: Company Data, Khaveen Investments
From the table, earnings from continuing operations contributed to 81% of the total cash inflow from operations ($6,085 mln) from 2017-2023, while earnings from discontinued operations contributed 57.2% of the total cash inflow, particularly the significant earnings from discontinued operations of the business divested to Broadcom ($3,309 mln) in 2019. Depreciation and Amortization saw a relatively stable trend over the years, ranging from $101 to $256 mln, contributing 21.8% in total cash flow from operations, whereas changes in working capital contributed 6.1% ($372 mln) over the same period. In total, the company generated around $10.1 bln in cash inflows from net earnings, D&A, and changes in working capital. However, it was partly offset by $4,024 mln in cash outflows from other cash transactions, resulting in a total of $6,085 mln of cash from operations over the past seven years.
Overall, the highest contributor to operating cash flow was net earnings of $8.4 bln cash inflow (138.2% of total) and the lowest contributor was from other cash transactions of $4.0 bln cash outflow (-66.1% of total). Notably, the high cash outflows in 2019, amounting to around $5.5 bln, were primarily due to non-cash gains associated with the divestiture to Broadcom (AVGO). These gains, reported as the operating activity, did not involve actual cash transactions, including $3.3 bln from earnings from discontinued operation, which was not real cash and thus was subtracted from the operating cash flow, and $2.2 bln from its income tax payment, which was real cash payment. Additionally, the company received $1.2 bln in cash in 2023. We identified most of it was attributed to the one-time deferred tax income of $900 received from the filings for a tax refund due to capital losses, highlighted in its recent earnings briefings and annual report.
|
Cash from Operations ($ mln) |
2017 |
2018 |
2019 |
2020 |
2021 |
2022 |
2023 |
Total |
|
Actual Operating Cash Flows |
950 |
1,495 |
(861) |
706 |
974 |
757 |
2,064 |
6,085 |
|
Adjusted Operating Cash Flows |
776 |
1,354 |
1,298 |
848 |
974 |
757 |
866 |
6,873 |
Source: Company Data, Khaveen Investments
Thus, we calculated the company’s adjusted cash from operations by excluding all the one-off items. We removed $1.2 bln of other cash transactions in 2023 which included the deferred tax received of $900 mln, and added back the income tax payment of discontinued operations of $2.2 bln, resulting in higher total cash inflows of around $1 bln which corresponds to higher adjusted operating cash inflow ($6.87 bln).
Investing Cash Flow
|
Cash Flow From Investing Activities |
2017 |
2018 |
2019 |
2020 |
2021 |
2022 |
2023 |
Total from 2017-2023 |
Breakdown of Total |
|
Capital Expenditure & Other Investing Activities |
(166) |
(226) |
(86) |
(11) |
(5) |
(4) |
(23) |
(521) |
-10.8% |
|
Sale of PPE & Divestitures |
933 |
26 |
10,918 |
218 |
355 |
0 |
25 |
12,475 |
258.3% |
|
Cash Acquisitions |
(401) |
(180) |
0 |
(344) |
(39) |
(6,547) |
0 |
(7,511) |
-155.5% |
|
Invest. in Marketable & Equity Securt. |
(387) |
139 |
547 |
68 |
15 |
4 |
0 |
386 |
8.0% |
|
Cash from Investing |
(21) |
(241) |
11,379 |
(69) |
326 |
(6,547) |
2 |
4,829 |
100% |
Source: Company Data, Khaveen Investments
From the table above, the company received a total of $4.8 bln from investing activities over the past seven years, mainly contributed by the sale of PPE and Divestitures of $12.5 bln (258.3% of total investing cash flow). However, it was offset by its total cash outflows for the acquisition of $7.5 bln (-155.5% of total investing cash flow). Meanwhile, Capex and Other Investing Activities contributed to the total cash outflow of $521 mln (-10.8% of the total), while Investment in Marketable & Equity Security helped the company gain $386 mln of cash inflow (8.0% of the total).
|
Cash from Investing |
2017 |
2018 |
2019 |
2020 |
2021 |
2022 |
2023 |
Total |
|
Actual Investing Cash Flows |
(21) |
(241) |
11,379 |
(69) |
326 |
(6,547) |
2 |
4,829 |
|
Adjusted Investing Cash Flows |
(21) |
(241) |
461 |
(69) |
326 |
0 |
2 |
458 |
Source: Company Data, Khaveen Investments
Regarding the unusual item, we identified that the company received $10.9 bln on sales of PPE & Divestitures in 2019, and we believe most of it came from the gain of $10.7 bln from divesting the entire of its “Enterprise Security Assets to Broadcom in 2019”. In addition, there was a $6.5 bln cash acquisition in 2022, of which $5.9 bln came from the merger with Avast. Therefore, excluding the one-time divestiture in 2019 and acquisition in 2022, the adjusted total cash inflow from investing activities over the past seven years was only $458 mln.
Financing Cash Flow
|
Cash Flow from Financing Activities ($ mln) |
2017 |
2018 |
2019 |
2020 |
2021 |
2022 |
2023 |
Total from 2017-2023 |
Breakdown of Total |
|
Issuance (repayment) of debt |
(3,278) |
(604) |
(1,106) |
(1,192) |
(29) |
5,907 |
(1,183) |
(1,485) |
10.4% |
|
Issuance of equity (Share Repurchases) |
14 |
(388) |
(1,536) |
(338) |
(1) |
(912) |
(455) |
(3,616) |
25.2% |
|
Dividends received (payment) to shareholders |
(211) |
(217) |
(7,481) |
(373) |
(303) |
(314) |
(323) |
(9,222) |
64.4% |
|
Cash from Financing |
(3,475) |
(1,209) |
(10,123) |
(1,903) |
(333) |
4,681 |
(1,961) |
(14,323) |
100% |
Source: Company Data, Khaveen Investments
From the table above, the company saw total cash outflows from financing activity of $14,323 mln over the past seven years, mainly contributed by dividends payment to shareholders which was 64.4% ($9,222 mln) of total cash outflows. In addition, the company’s share repurchase program accounted for another 25.2% of cash outflow with $3,616 mln in total. The lowest contributor is debt repayment with only 10.4% of the contribution share, amounting to $1,485 mln in total.
However, we noticed a large amount of cash was used for debt repayment over the years, though it was mostly offset by the issuance of debt of $8.9 bln in 2022, which we believe was used to complete the acquisition of Avast. Additionally, though the company continued to repay $3.3 bln of debt in that year, the debt issued resulted in a positive cash inflow of $4.7 bln for the company overall, which also reduced the total debt repayment over the past seven years. Furthermore, while dividend payment was relatively stable over the years, there was a substantial amount of $7.5 bln paid out in 2019, which we identified to be a special dividend paid to shareholders following the divestiture of the company’s Enterprise Security Assets to Broadcom.
|
Cash from Financing ($ mln) |
2017 |
2018 |
2019 |
2020 |
2021 |
2022 |
2023 |
Total |
|
Actual Financing Cash Flows |
(3,475) |
(1,209) |
(10,123) |
(1,903) |
(333) |
4,681 |
(1,961) |
(14,323) |
|
Adjusted Financing Cash Flows |
(3,475) |
(1,209) |
(2,642) |
(1,903) |
(333) |
(4,273) |
(1,961) |
(15,796) |
Source: Company Data, Khaveen Investments
Therefore, we calculated the adjusted financing cash flows by excluding the special dividend payment in 2019, as it was a one-time event, and the debt issuance in 2022, as the company would not have issued debt if it had not pursued the acquisition, which we have already excluded from our adjusted investing cash flow. For the adjustment, we removed debt issuance of $8.9 bln and added back a special dividend payment of $7.4 bln, resulting in higher total cash outflows of $1.5 bln which corresponds to higher adjusted financing cash outflow ($15.8 bln).
Future Cash Flows
|
Comparison ($ mln) |
2017 |
2018 |
2019 |
2020 |
2021 |
2022 |
2023 |
Total |
|
Actual Operating Cash Flows |
950 |
1,495 |
(861) |
706 |
974 |
757 |
2,064 |
6,085 |
|
Actual Investing Cash Flows |
(21) |
(241) |
11,379 |
(69) |
326 |
(6,547) |
2 |
4,829 |
|
Actual Financing Cash Flows |
(3,475) |
(1,209) |
(10,123) |
(1,903) |
(333) |
4,681 |
(1,961) |
(14,323) |
|
Total Cash Flows |
(2,546) |
45 |
395 |
(1,266) |
967 |
(1,109) |
105 |
(3,409) |
|
Adjusted Operating Cash Flows |
776 |
1,354 |
1,298 |
848 |
974 |
757 |
866 |
6,873 |
|
Adjusted Investing Cash Flows |
(21) |
(241) |
461 |
(69) |
326 |
0 |
2 |
458 |
|
Adjusted Financing Cash Flows |
(3,475) |
(1,209) |
(2,642) |
(1,903) |
(333) |
(4,273) |
(1,961) |
(15,796) |
|
Adjusted Total Cash Flow |
(2,720) |
(96) |
(883) |
(1,124) |
967 |
(3,516) |
(1,093) |
(8,465) |
Source: Company Data, Khaveen Investments
We compiled the actual total cash flows reported over the years and our adjusted total cash flows, excluding all one-off items. During 2017-2023, the company generated $3,409 mln in total cash outflows attributed mainly to the cash outflows of $14,323 mln from financing activities, particularly the special dividend payment in 2019. However, after adjustments, our calculations showed that the total cash outflow was $8,465 mln, which was $5,056 mln higher than the actual due to the increase of $788 mln from operating cash flow, decrease of $4,371 mln from investing cash flow, and decrease of $1,473 mln from financing cash flow.
Company Data, Khaveen Investments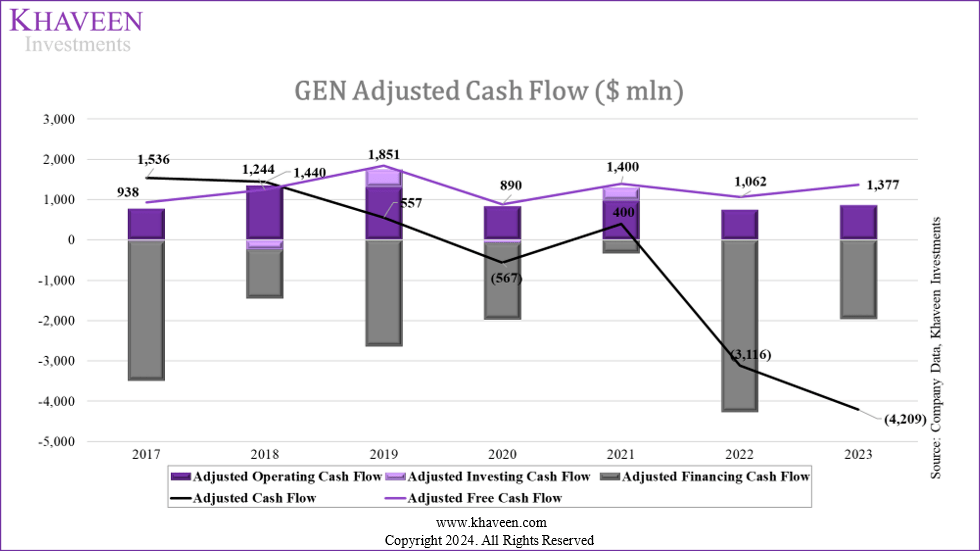
We believe the adjusted total cash flow is more reflective of the company’s true cash position as it did not take into account one-off items such as cash inflows from divestitures, large debt issuance, or cash outflows from acquisition, share repurchases, and special dividend payments. Consequently, the company’s adjusted cash level would have seen an increasingly deteriorating cash position from $1,536 mln at the end of 2017 to -$4,209 mln at the end of 2023.
Debt & Cash Analysis
From our income statement and cash flow projections, we can now forecast the company’s total debt and cash balances moving forward.
Company Data, Khaveen Investments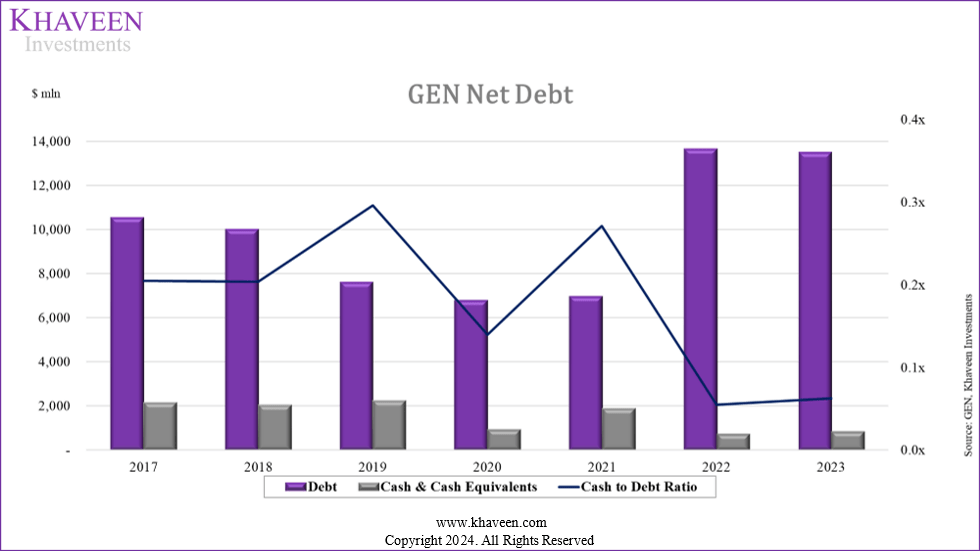
From the chart, the company showed a trend of debt repayment from 2017 to 2020. However, the debt slightly increased back in 2021 followed by a surge to $13.5 bln in 2022, attributed to debt issuance of $8.9 bln to pursue the merger with Avast. Consequently, this resulted in a lower cash-to-debt ratio of only 0.05x in 2022 and 0.06x in 2023, indicating that its debt is now 16x higher than its current cash level. Given the company’s declining cash trend, we believe this high indebtedness is concerning. This will be a significant drag on the company’s cash, and as previously mentioned, the interest payments as % of revenue has reached 17.5%.
The comparison chart below shows a better picture of the actual cash levels and our adjusted cash levels. Though the company’s actual cash also saw a total decline of $1,316 mln over the past seven years, we believe its cash would have declined more when excluding non-continuing operations, mainly due to its high debt repayment and share repurchases program.
Company Data, Khaveen Investments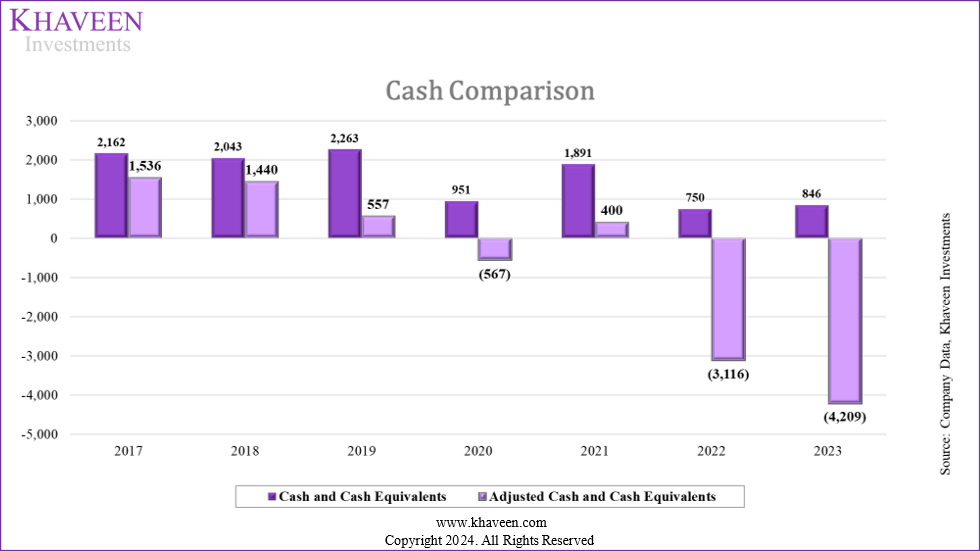
Future Cash & Debt Positions
Given the company’s low cash level and the current trend of high debt repayment, we needed to examine different scenarios to determine if the company should continue to repay the debt or maintain the current debt, which will be discussed together with the cash flow forecast.
|
Interest Expense Projection |
2024F |
2025F |
2026F |
2027F |
2028F |
|
LT Debt ($ mln) |
10,927 |
10,927 |
10,927 |
10,927 |
10,927 |
|
Interest expense as % of Debt (%) |
4.95% |
4.95% |
4.95% |
4.95% |
4.95% |
|
Interest expense ($ mln) |
541.1 |
541.1 |
541.1 |
541.1 |
541.1 |
Source: Company Data, Khaveen Investments
We then created three scenarios to assess whether the company could generate positive cash flow or not:
- Scenario 1: Maintain all current programs (dividend payment, share buyback, and debt repayment)
- Scenario 2: Assume the company cuts its share buyback program
- Scenario 3: Assume the company cuts its share buyback program and debt repayment
Our forecasts from the first section are the same for all scenarios until the EBIT. Since changes in each scenario affect the interest expense (through changes in debt level) and tax expense (through changes in EBT), our scenario analysis computes the company’s EBT and net earnings separately. Additionally, as we assumed the company to continue repaying its debt in both scenarios 1 and 2, we expect its interest expense to decrease in accordance with the decrease in debt level. In contrast, its interest expense would remain the same ($541 mln) if the company decided not to repay its debt in scenario 3.
Regarding cash flow, we forecasted each of the operating activities, investing activities, and financing activities separately. In scenario 1, in which we assumed normal operations, we forecasted debt repayment based on a seven-year average of $1,491 mln, share buybacks based on a seven-year average of $517 mln, and dividend payments based on a four-year average of $328 mln, as the dividend per share has remained constant over the past four years, resulting in total cash outflows of $2,336 mln annually. In Scenario 2, the financing cash outflows would be $516.6 mln lower than in Scenario 1, due to the cut of share buybacks. In Scenario 3, the cash outflows from financing activities would be $1,491 mln lower than in Scenario 2, as debt repayments are as well excluded.
|
Cash Flow Forecasts ($ mln) |
2024F |
2025F |
2026F |
2027F |
2028F |
|
Net Increase (decrease) in Cash (Scenario 1) |
(1,196) |
(1,099) |
(1,022) |
(934) |
(984) |
|
Net Increase (decrease) in Cash (Scenario 2) |
(679) |
(582) |
(505) |
(417) |
(467) |
|
Net Increase (decrease) in Cash (Scenario 3) |
812 |
851 |
869 |
899 |
790 |
Source: Company Data, Khaveen Investments
In scenario 1, if the company were to operate maintaining all current programs, it would end the fiscal year 2024 with a negative cash flow of $1,196 mln leading to a negative closing cash balance of -$350 mln, We believe to avoid generating negative cash flow and ensure business survival, the company might first consider cutting its current share repurchase program, which was illustrated in scenario 2.
However, even if the company tried cutting its share buybacks, it would be cash balance positive in 2024 but then still have a negative cash balance of -$415 mln in 2025 as the cash inflows from operating activities would not be enough to offset cash outflows from investing and financing activities, including Capex, other investing activities, debt repayment, and dividend payments. Thus, our last scenario assumed the company would maintain its current debt level while cutting its share buyback. This is the only scenario in which the company could maintain a positive cash flow as it would have net positive cash flow each year. Hence, this scenario allows us to project the company’s financial position going forward.
Company Data, Khaveen Investments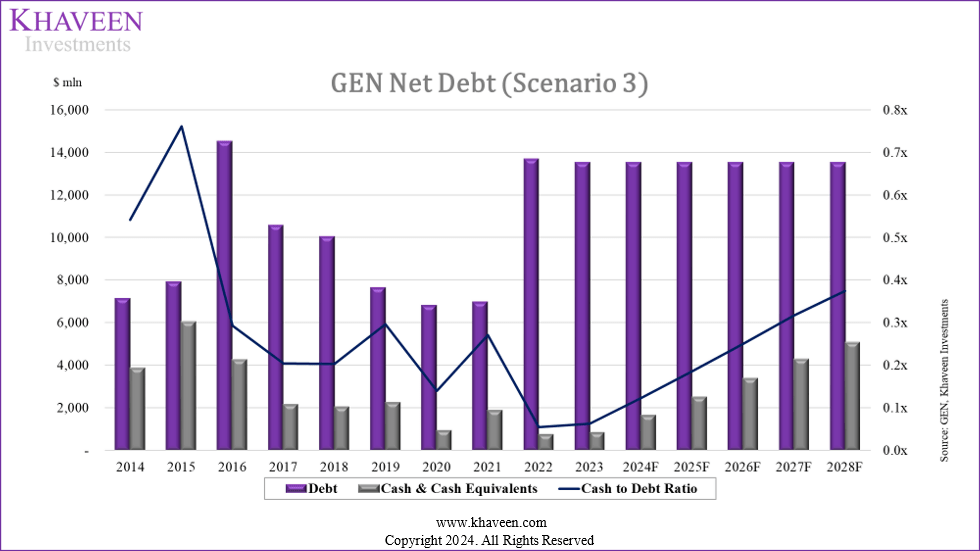
|
Net Debt (Net Cash) (Scenario 3) |
2023 |
2024F |
2025F |
2026F |
2027F |
2028F |
|
Debt |
13,509 |
13,509 |
13,509 |
13,509 |
13,509 |
13,509 |
|
Cash & Cash Equivalents |
846 |
1,658 |
2,509 |
3,378 |
4,277 |
5,067 |
|
Net Debt (Net Cash) |
12,663 |
11,851 |
11,000 |
10,131 |
9,232 |
8,442 |
|
Cash to Debt Ratio |
0.06x |
0.12x |
0.19x |
0.25x |
0.32x |
0.38x |
Source: Company Data, Khaveen Investments
In the last scenario, the company’s closing cash balance is finally positive at $1,153 mln at the end of fiscal year 2024F, as the cash inflows from operating activities are now higher than cash outflows from investing and financing activities. We expect its cash to increase from $846 mln to $2,702 mln by 2028F, mainly attributed to its operating cash flows. In reality, the company might still need to repay some of its debt, although it could potentially raise additional debt to cover these repayments and just keep rolling the debt forward.
Risk: Competition In Consumer Cybersecurity
We believe one of the risks for the company is the intense competition in consumer cybersecurity. Despite having a notable foothold in the market post-acquisition, the company’s analyst consensus revenue growth average of 2.4% indicates a challenging growth outlook for the company compared to the market forecast CAGR of 9%. One notable threat is from Microsoft (MSFT), whose cybersecurity business revenues had doubled in two years with several developments and initiatives such as Microsoft’s Secure Future Initiative as the company increasingly targets cybersecurity and we believe poses a risk for GEN.
Verdict
All in all, we believe that while the company’s earnings are positive and sufficient to cover its interest obligations with an average 5-year forward projected EBIT margin of 33.89%, we believe its cash flow is not enough to cover its financial programs such as share buybacks and debt principal repayments. Our forecast for the company’s 5-year forward FCF margins are at an average of 38% which translates to around $800 million a year. Whie this is enough to cover dividend payments of $328 mln per year (four-year average), it is not enough to also cover its share buybacks of $517 mln per year (seven-year average) and to make any debt principal payments. Therefore, we believe these programs are unsustainable given the company’s current financial position and believe it may need to significantly reduce its share buybacks and defer its debt principal repayments to maintain an adequate financial position.
For our valuation of the company, we conducted two valuations based on market average EV/EBITDA and company historical average EV/EBITDA and compared the two. We derived it using our EBITDA forecasts in 2028 with the average five-5-year EV/EBITDA of selected cybersecurity companies of 13.94x to calculate the enterprise value of the company.
Guru Focus, Khaveen Investments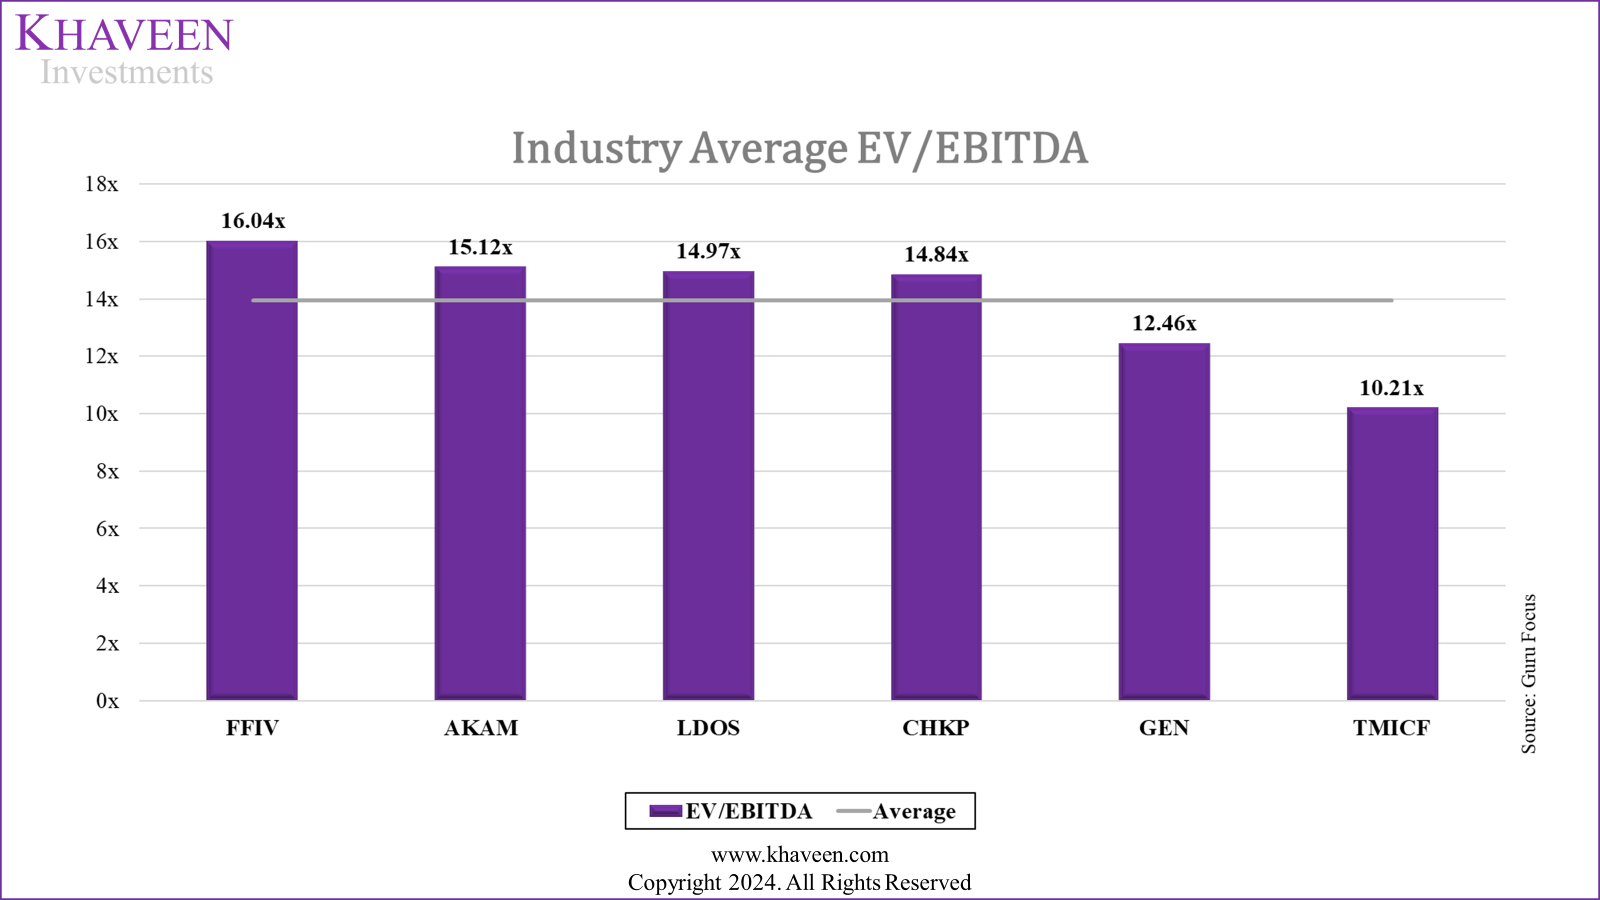
Furthermore, after subtracting our debt projections and adding our cash projections, we derived an equity value of $15.5 bln in 2028, resulting in a price target of $24.80. After prorating our 2028 price target to calculate our 2024, we derived a limited upside of 0.3% with a price target of $24.47 based on the market average EV/EBITDA.
|
Valuation (Average EV/EBITDA) |
2028F(Market Average) |
2028F (Historical Average) |
|
EBITDA ($ mln) |
1,719 |
1,719 |
|
Average EV/EBITDA (5-year) |
13.94 |
12.46 |
|
Enterprise Value ($ mln) |
23,965 |
21,415 |
|
Debt ($ mln) |
13,509 |
13,509 |
|
Cash & Cash Equivalents ($ mln) |
5,067 |
5,067 |
|
Equity Value ($ mln) |
15,523 |
12,973 |
|
Shares Outstanding (MLN) |
626.1 |
626.1 |
|
Price Target ($) |
24.8 |
20.7 |
|
Current Price ($) |
24.39 |
24.39 |
|
Upside % |
1.6% |
-15.1% |
Source: Khaveen Investments
|
Valuation |
2024F |
2025F |
2026F |
2027F |
2028F |
|
Current Price ($) |
24.39 |
24.39 |
24.39 |
24.39 |
24.39 |
|
Price Target ($) – (Market Average) |
24.47 |
24.55 |
24.63 |
24.71 |
24.8 |
|
Upside % |
0.3% |
0.7% |
1.0% |
1.3% |
1.6% |
|
Price Target ($) – (Historical Average) |
23.61 |
22.85 |
22.12 |
21.41 |
20.7 |
|
Upside % |
-3.2% |
-6.3% |
-9.3% |
-12.2% |
-15.1% |
Source: Khaveen Investments
Based on the company’s historical EV/EBITDA of 12.46x, we derived a price target of $20.70 in 2028 based on an equity value of $12.97 bln and prorated it to obtain our 2024 price target of $23.61, which translates to a downside of 3.2%. We believe this price target is more appropriate and conservative compared to the market average EV/EBITDA price target ($24.47), thus we based our price target rating on the company’s historical EV/EBITDA price target of $23.61 and rate the company as a Hold.