Fundamental
Overview
Gold has been feeling the pressure from the rise in real yields lately as
the opportunity cost of holding into gold at these levels remains high. We will
likely need some downside surprise in the US inflation data or weak economic reports
to trigger another sustained rally. At the moment, the picture is murky, but the
bias is still a bit more bearish.
Gold
Technical Analysis – Daily Timeframe
Gold Daily
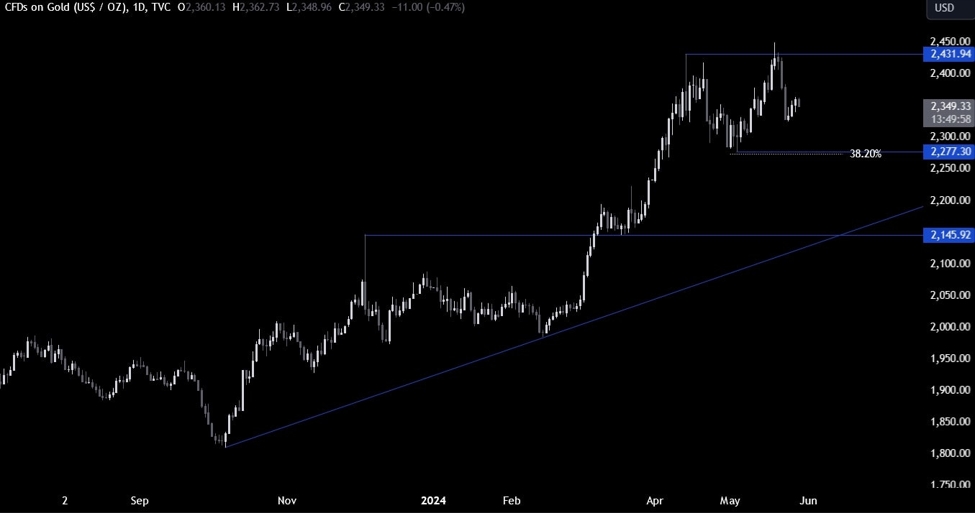
On the daily chart, we can
see that gold sold off after setting a new all-time high as the rise in real
yields started to weigh on the market. From a risk management perspective, the
buyers will have a better risk to reward setup around the 2277 support
where we can also find the 38.2% Fibonacci
retracement level for confluence.
The sellers, on the other hand, will want to see the price breaking lower to
increase the bearish bets into the major trendline
around the 2150 level.
Gold Technical Analysis
– 1 hour Timeframe
Gold 1 hour
On the 1 hour chart, we can
see that we have a minor upward trendline acting as support for the uptrend on
this timeframe. The sellers have the option to lean on the resistance around
the 2371 level where they will also find the 38.2% Fibonacci retracement level
for confluence, or pile in on a downside breakout of the trendline. The buyers,
on the other hand, will want to see the price breaking above the 2371 resistance
to invalidate the bearish setup and increase the bullish bets into a new
all-time high.
Upcoming
Catalysts
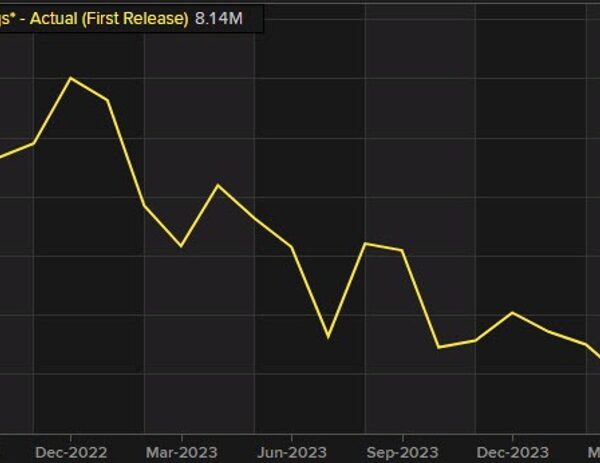
Tomorrow we will see the latest US Jobless Claims figures and on
Friday, we conclude the week with the US PCE report.