Fundamental
Overview
The FOMC decision on Wednesday didn’t
provide anything new. In fact, the Fed delivered on expectations with no
surprises whatsoever. The central bank kept rates steady, reduced the QT pace,
revised growth lower and inflation higher, and kept the dot plot mostly unchanged.
Fed Chair Powell
acknowledged the current uncertainty around Trump’s policies and the inflation
outlook but confirmed that the economy remains healthy, and the Fed is in a
good position to wait for more clarity.
In the bigger picture, as
long as the Fed doesn’t change its reaction function and doesn’t mention rate
hikes, the trend should remain to the upside as real yields will continue to
fall unless we get another strong growth scare. Therefore, all the technical
pullbacks continue to be just dip-buying opportunities.
The next key event is
scheduled for Monday when we get the US Flash PMIs which coupled with the UMich
inflation expectations triggered the growth scare last month.
Gold
Technical Analysis – Daily Timeframe
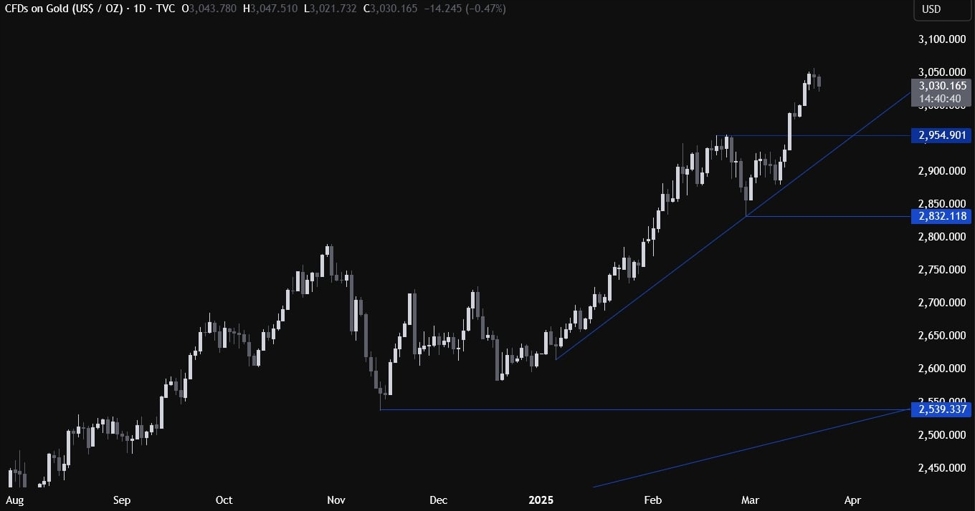
Gold Daily
On the daily chart, we can
see that gold got into some consolidation around the 3050 level as we haven’t
got anything new in terms of fundamentals. From a risk management perspective,
the buyers will have a better risk to reward setup around the 2955 level where
they will also find the trendline
for confluence.
The sellers, on the other hand, will want to see the price breaking below the trendline
to target the 2832 level next.
Gold Technical Analysis
– 4 hour Timeframe
Gold 4 hour
On the 4 hour chart, we can
see that we have a minor support around the 3020 level which is also the
neckline of the head
and shoulders formation. This is where we can expect the buyers to step in
with a defined risk below the neckline to position for a rally into new highs.
The sellers, on the other hand, will look for a break lower to gain more
conviction and pile in for a drop into the 2955 level next.
Gold Technical Analysis
– 1 hour Timeframe
Gold 1 hour
On the 1 hour chart, we can
see that we have a counter-trendline that is defining the current pullback and
can turn into a bullish pennant if the price were to break to the upside. In
such a case, the buyers will likely increase the bullish bets into new highs,
while the sellers will likely lean on the counter-trendline to position for the
break below the neckline and the 2955 level next. The red lines define the average daily range for today.