Fundamental
Overview
Gold had a really bad Friday last week as it suffered one of its worst days
in several months. The reason for the selloff was due to two strong catalysts.
The first one hit in the European session when we got the headline that China
halted its reserve buying.
This has been the prevailing market narrative for the strong gains in the
past months, so it weighed on the price as market participants retrenched.
Then, in the US session, we got a strong NFP
report that saw the market repricing once again interest rates expectations
on the more hawkish side and real yields spiked to the upside taking gold
downward with them.
The sentiment in the gold market is now a bit soft, so we will need a
catalyst to give the buyers more confidence to keep charging higher. This
catalyst will likely come on Wednesday when we will get the US CPI and the FOMC
decision.
A hot US CPI report will likely trigger another selloff and take us to new
lows, while cold figures should give the market a boost.
Gold Technical
Analysis – Daily Timeframe
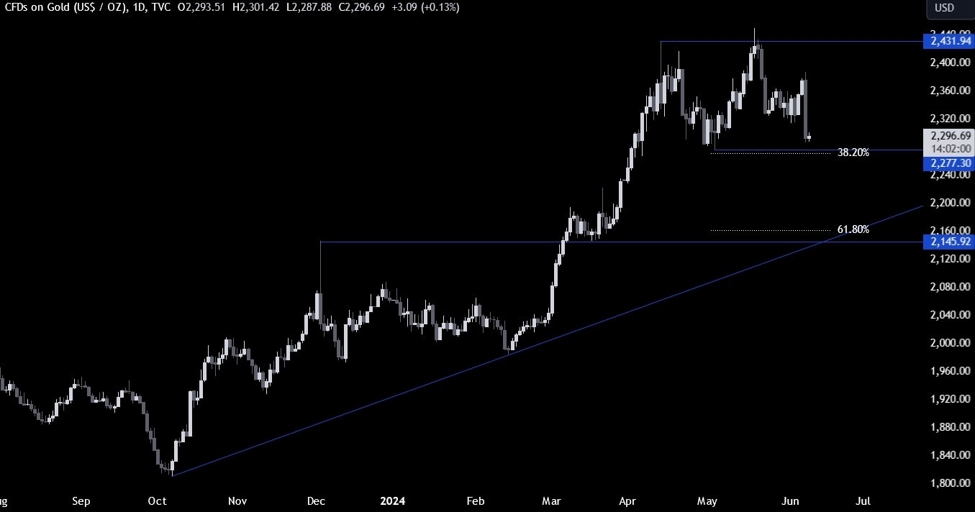
Gold Daily
On the daily chart, we can
see that gold sold off into the strong support around the 2277 level where we can also find
the 38.2% Fibonacci retracement level for confluence. This is where we can expect the
buyers to step in with a defined risk below the support to position for a rally
into a new all-time high with a much better risk to reward setup.
The sellers, on the other
hand, will want to see the price breaking lower to increase the bearish bets
into the major trendline around the 2150 level where we can
also find the 61.8% Fibonacci retracement level for confluence.
Gold Technical Analysis
– 4 hour Timeframe
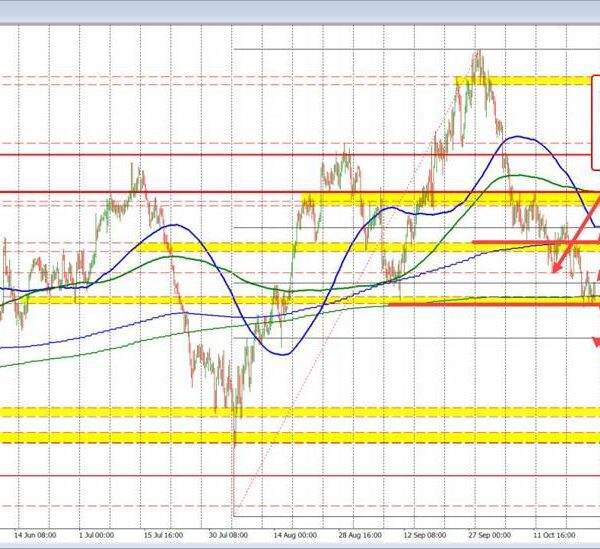
Gold 4 hour
On the 4 hour chart, we can
see that from a risk management perspective, the sellers will be better off
waiting for a pullback into the recent support-turned
resistance around the 2320 level where they will also find the 38.2% Fibonacci
retracement level for confluence.
The buyers, on the other
hand, will want to see the price breaking higher to invalidate the bearish
setup and increase the bullish bets into the all-time high.
Gold Technical Analysis
– 1 hour Timeframe
Gold 1 hour
On the 1 hour chart, we can
see the two catalysts that sent gold lower on Friday. There’s not much to do
here as the price trades right in the middle of the two key zone. The red lines
show the average
daily range for today, so in case the price reaches one of the two zone,
the market participants will have defined levels where to protect their stops.
Upcoming
Catalysts
This week is a bit empty
on the data front although we will have the biggest market moving events on
Wednesday when we get the US CPI data and the FOMC rate decision. On Thursday,
we have the US PPI and the latest US Jobless Claims figures. On Friday, we conclude
the week with the University of Michigan Consumer Sentiment survey.