Fundamental
Overview
The price action in gold continues to be rangebound amid some mixed drivers.
The real yields rose recently and that kept a lid on the upside, but there was
no signal of inflationary pressures in the economic data and interest rates
expectations remained unchanged.
There is a compelling narrative emerging since the Trump-Biden debate that
Trump has basically already won the elections and his policies will be
inflationary. That would keep real yields higher for longer or even lead to a
sizeable increase.
Although, this narrative has some good arguments, it looks premature to
price in such developments now given that the context is different. The market
might have moved on it so much mainly because there was nothing else happening.
In the next weeks though we will get many key economic releases including
the NFP and CPI, so it will be interesting to see how the market will react to
these catalysts.
Gold
Technical Analysis – Daily Timeframe
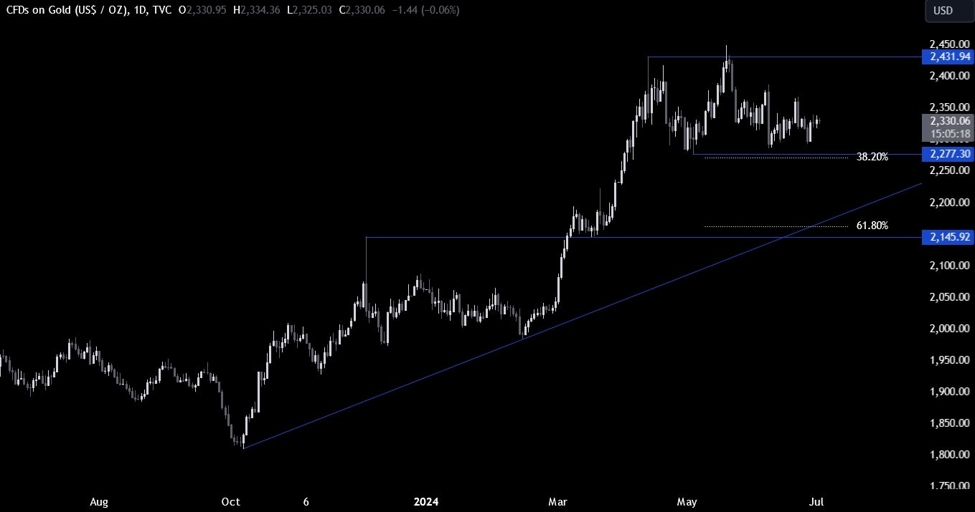
Gold Daily
On the daily chart, we can
see that gold continues to maintain a rangebound price action. From a risk
management perspective, the buyers will have a better risk to reward setup
around the key 2277 support zone where we can also find the 38.2% Fibonacci retracement level for confluence.
The sellers, on the other
hand, will want to see the price breaking below the support to change the bias
and increase the bearish bets into the next support around the major trendline where we can also find the 61.8% Fibonacci
retracement level for confluence.
Gold Technical Analysis
– 4 hour Timeframe
Gold 4 hour
On the 4 hour chart, we can
see that the price is now trading inside a tight range between the 2320 level
and the 2337 resistance. The buyers will want to see the price breaking higher to
gain more conviction and position for a rally into the 2387 level next. The
sellers, on the other hand, will want to see the price breaking lower to keep
targeting a drop into the 2277 support.
Gold Technical Analysis
– 1 hour Timeframe
Gold 1 hour
On the 1 hour chart, we can
see more clearly the tight range as we await the key catalysts in the next days.
If the price stays below the 2320 level, it will keep the bias more bearish in
the short term, while staying above the 2337 level would keep it more bullish. The
red lines define the average daily range for today.
Upcoming
Catalysts
Today we have the US Job Openings and Fed Chair Powell speaking. Tomorrow, we
get the US ADP, the US Jobless Claims, the US ISM Services PMI and the FOMC
Meeting Minutes. Thursday is going to be a US Holiday for Independence Day.
Finally, on Friday, we conclude the week with the US NFP report.