Fundamental
Overview
The PBoC tonight surprised with rate
cuts across many key benchmarks. It’s no secret that rate cuts are
generally positive for stocks, but the question will be if it’s going to be
enough for a sustained rally after the big correction from the cycle high set
on May 20th.
The recent PBoC policy
framework reform suggests that the Chinese officials could take more
actions to spur growth. So, the question should be if it’s enough to take some
risk with a possibly high reward.
Hang Seng
Index Technical Analysis – Daily Timeframe
Hang Seng Index Daily
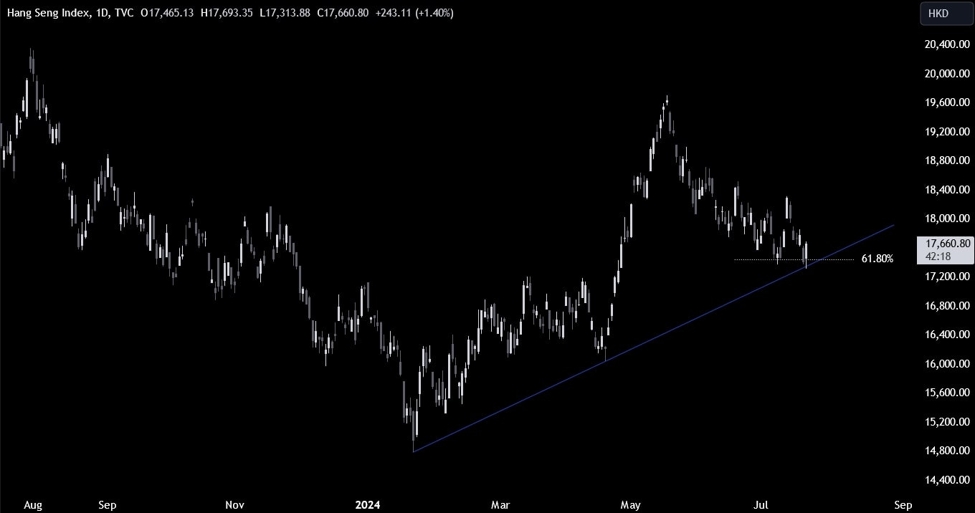
On the daily chart, we can
see that the price bounced from a key support
zone around the 17300 level where we had the confluence
of the previous swing high, the major trendline
and the 61.8% Fibonacci
retracement level.
That’s where the buyers
stepped in with a defined risk below the trendline to position for a rally into
a new cycle high. The sellers, on the other hand, will want to see the price
reversing and breaking through the trendline to increase the bearish bets into the
16000 level next.
Hang Seng Index Technical
Analysis – 4 hour Timeframe
Hang Seng Index 4 hour
On the 4 hour chart, we can
see that the bearish momentum seemed to be waning as the lower lows became
shallower. The bounce got the support not only from the technical levels but
also from the PBoC catalyst. The next target could be the 18300 level where we
can also find the 38.2% Fibonacci retracement level of the entire correction
lower.
That’s where we can expect
the sellers to step in with a defined risk above the level to position for a
drop back into the trendline looking for a breakout. The buyers, on the other
hand, will want to see the price breaking higher to increase the bullish bets into
a new cycle high.
Hang Seng Index Technical
Analysis – 1 hour Timeframe
Hang Seng Index 1 hour
On the 1 hour chart, we can
see that the price broke through the downward minor trendline today. This might
see more buyers piling in and increasing the bullish momentum, although there’s
still a resistance zone around the 17700 level. The sellers might want to wait
for a break below the major trendline or a rally into the 18300 resistance before
increasing the bearish bets.
Upcoming
Catalysts
This week is pretty empty on the data front. We begin on Wednesday with the
release of the US Flash PMIs. On Thursday, we will get the latest US Jobless
Claims figures. Finally, on Friday we conclude the week with the US PCE report.