

Getty Images
“There is a good reason why the rearview mirror is smaller than the windshield.” – Ted Lasso
The Stylus is Stuck
Back in the day, before 8-track and cassette tapes, to play music one placed a vinyl record on a turntable and the needle (or stylus) dropped down on the record to play the music. From time to time the stylus would get stuck and play the song track contained in the groove repeatedly unless one gave the stylus a slight nudge. At the end of the third quarter, it seems the same stocks are responsible for the Q3 2026 market return as have driven market returns over the past few years, not unlike the stylus being stuck and playing the same part of a song over and over again.
As noted by recent commentary from Citadel Securities:
Microsoft (MSFT), NVIDIA (NVDA), Apple (AAPL) and Meta Platforms (META) alone contributed roughly 300 points to the S&P 500 in Q3, or more than 200% of the index’s entire gain. The rest of the index collectively detracted roughly 150 points.
For every $1 allocated to the S&P 500 Index:
- 41¢ goes to the top 10 companies.
- 35¢ goes to the Mag 7 alone.
- 19¢ goes to Semiconductors.
- NVDA alone receives roughly 8¢, more than the smallest 256 companies combined.
The four stocks highlighted above are a part of the so-called Magnificent 7 stocks. In other words, the Mag 7 continued to drive a large part of the return in the third quarter. Further, the S&P 500 Index’s total return for the third quarter equaled 2.30% and the technology sector alone contributed 2.72 percentage points. The bottom seven performing sectors detracted -1.86 percentage points for the quarter.
Despite this narrow leadership in the quarter, the S&P 500 Equal Weighted Index (SPXEW) outperformed the S&P 500 Capitalization Weighted Index (SP50) until the month of September. The outperformance of the equal-weighted index is indicative of a broadening equity market. However, in September, the S&P 500 Index was down -0.35% and the equal weight S&P 500 Index was down -4.81% resulting in the SPXEW Index falling behind the cap-weighted S&P 500 Index on a year-to-date basis. Although the S&P 500 Index is less than two percentage points from its high, 22% of the stocks in the index are down more than 20% from their high and 65% are down more than 10% from their high. Through the third quarter the market has corrected, but it has been a correction over time versus simply price as the large mega cap technology stocks have masked the weakness in the market.
A Midterm Election Year
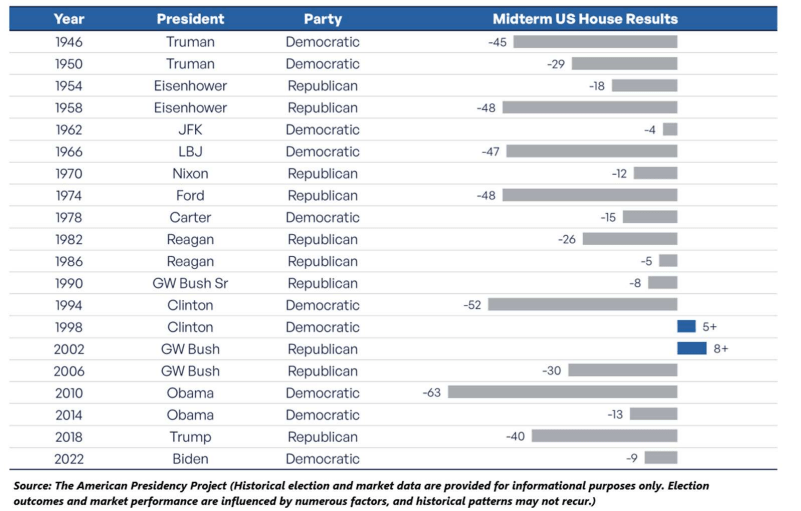
In prior Investor Letters written around the presidential cycle we noted the market ultimately looks past these events. A large part of the reason for this is the fact companies will adjust to the policies that result from the election outcome. Importantly, a lot of noise occurs around the lead up to the election and concern surrounding the composition of Congress. However, the market knows the midterm election is one where the incumbent party almost always loses seats. Near is a chart going back to 1946 showing the midterm results for the U.S. House and in only two elections, 1998 and 2002, did the president’s party gain seats. In the mid-terms, the president’s party loses an average of 22 seats.
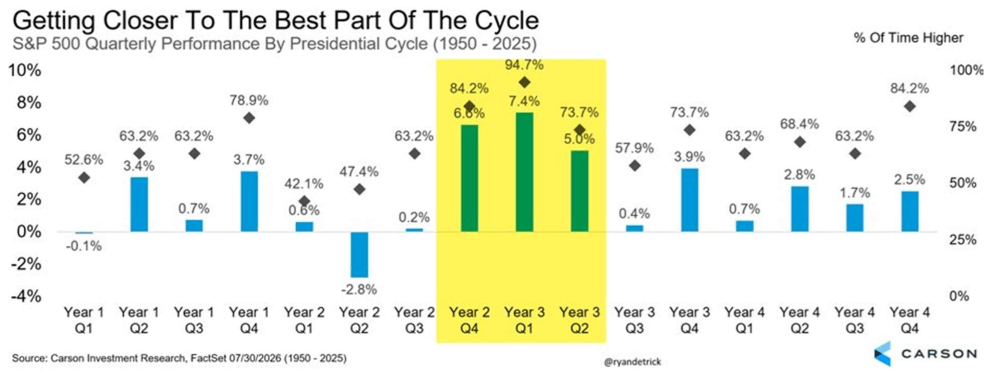
From a performance perspective, the equity market is entering the most bullish period in the four-year presidential cycle. As the chart below shows, Q4 of year 2 and Q1 and Q2 of the third year are the strongest three quarters in the 4-year cycle.
A Resilient Economy
In the third quarter investors’ decisions were influenced by elevated energy prices, continued tensions in the Middle East, and the Federal Reserve’s first rate increase in three years. These factors weighed on investor sentiment, but through it all the underlying economy held up well, and corporate earnings continued to surprise to the upside. Final second quarter year-over-year (YoY) earnings growth reported by LSEG I/B/E/S shows an increase of 53.7%. This is the type of earnings growth one would see coming
out of a recession, which is not the case for the currently growing economy. Third quarter earnings reporting season is just getting underway and S&P 500 YoY earnings growth is expected to be up +30.6%
U.S. economic growth was modest in Q2. Real GDP grew at an annual rate of 2.2%; however, consumer spending grew 3.8% and business investment grew at an annualized rate of 9%. The strong business investment growth is filtering into other segments of the economy, specifically those related to AI data center projects. The estimate for GDP growth in the third quarter is a stronger 3.7% as reported by the Atlanta Fed’s GDPNow estimate.
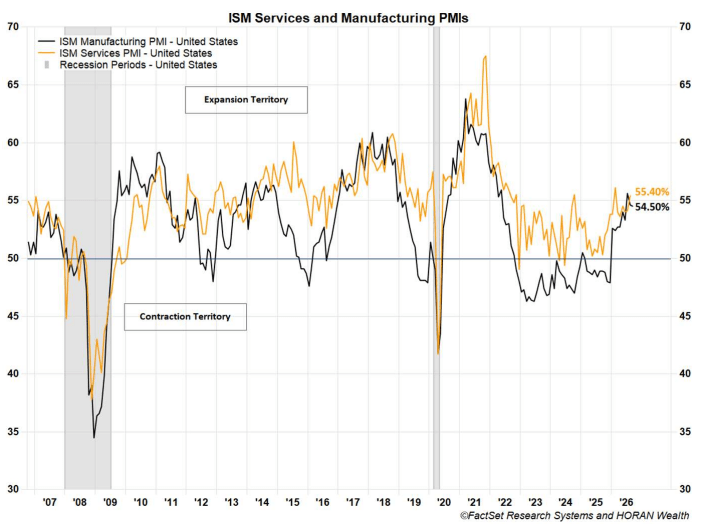
Lastly, on the manufacturing and services portion of the economy, the ISM Manufacturing PMI was 54.5 in September, down slightly from 54.6 in August. It was the ninth consecutive month of expansion, a meaningful turnaround after factory activity contracted for much of 2025. The ISM Services PMI rose to 55.4 in August from 54.1 in July, the strongest growth in six months. One caution is that businesses reported their highest price pressures in four years, driven by fuel costs. Purchasing managers’ indexes (PMI’s) survey business executives each month and readings above 50 signal expansion.
The Fed Acts
It was not long after the new Fed Chair Kevin Warsh assumed his leadership role at the Federal Reserve that he acted on interest rates and delivered the Fed’s first rate hike since 2023 at its September meeting. The Fed increased the Fed Funds target range by 0.25% to 3.75%–4.00%. Chairman Warsh described the move as removing accommodation rather than tightening policy, and Fed officials’ median projection now places the policy rate around 4.1% through 2026 and 2027.
The move in the Fed Funds rate comes on the heels of a quick increase in market interest rates this year. In February the 10-year U.S. Treasury yield equaled 3.97% and in September reached 5.28%, the highest level in over 20 years. As bond prices move in the opposite direction of interest rates, this was a headwind for bond returns, but not as significant as the higher rate environment in 2022 when the total return for the 10-year U.S. Treasury was a negative 16.9%. Year to date through September the Bloomberg US
Aggregate Bond Index was down 3.3%. Much of this decline occurred in September as the Aggregate Index was down 2.6% in the month. This is the sixth worst September performance in the past thirty years for the Bloomberg US Aggregate Bond Index.
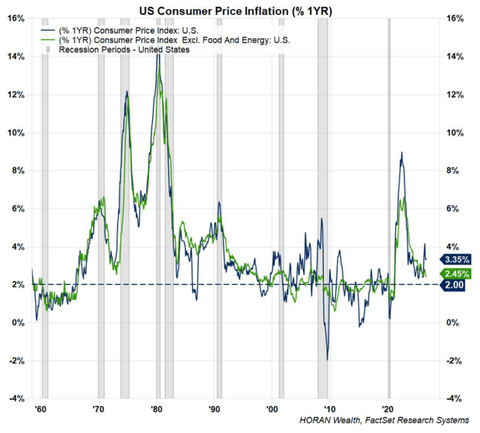
The Fed’s pursuit of higher rates is its effort to contain elevated inflation. The most recent report on inflation shows the Consumer Price Index at 3.35% and the CPI ex food and energy stands at 2.45%, both above the Fed’s 2% target inflation rate. The other inflation measure that is important to the Fed is the Personal Consumption Expenditures Index or PCE. The PCE is a measure of the prices that people pay for goods and services. The PCE price index is known for capturing inflation (or deflation) across a wide range of consumer expenses and reflecting changes in consumer behavior. This index is at 3.45%, also above the Fed’s target level. Importantly, only 12 of the 402 PCE categories show a year-over-year price increase of more than 2%. Not surprisingly, energy is the largest YoY increase at 16.8%.
Looking Out the Windshield
In our last Investor Letter, we highlighted the capex spending by technology companies as the build out continues for data center capacity. There continues to be some pushback in communities where data centers are being built; however, we do believe the issues raised can be resolved and the artificial intelligence growth led by this expansion continues.
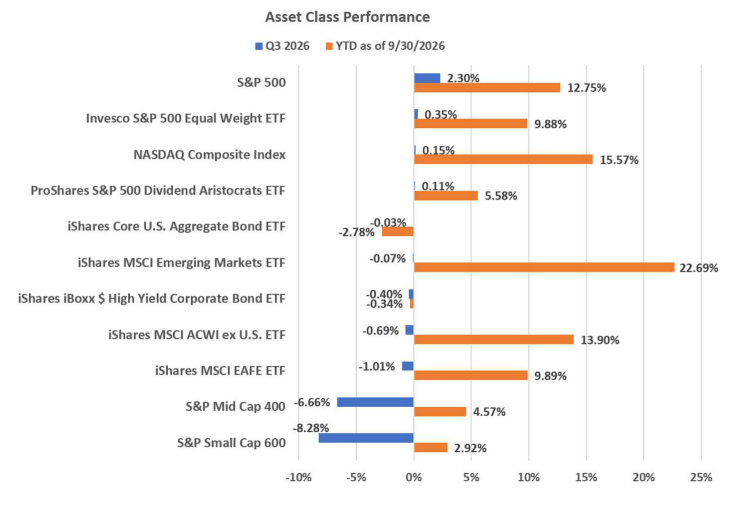
From a global perspective, international markets continue to offer investors reasonable returns, especially in the emerging market (EM) area as EM is outperforming the U.S. and developed international regions. As in the U.S. the growth of EM markets is largely led by companies in the technology segments of the market.
Lastly, as noted earlier in the newsletter, S&P 500 earnings growth is strong. For all of 2026 LSEG I/B/E/S expects earnings to be up 35.8%. With the year-to-date return for the S&P 500 Index equaling 12.8% as this is written, stocks are cheaper today compared to the beginning of the year. With earnings growth serving as a tailwind, this is supportive of higher stocks prices as one looks out over the next 12-18 months. One factor to keep in mind though is the fact the earnings growth rate is slowing. This fact can be a headwind for stocks; however, the currently high growth rate of earnings can overcome this potential issue. Additionally, if the inflation rate continues to decline which should lead to lower or stable interest rates, this can be a tailwind for stocks too.
Thank you for your continued confidence and support in HORAN Wealth and we are always available to answer your questions and discuss our outlook further. Please be sure to visit us for company news, reports, and our blog at Insights.
Respectfully,
HORAN Wealth
HORAN Wealth, LLC is an SEC Registered Investment Advisor.
Editor’s Note: The summary bullets for this article were chosen by Seeking Alpha editors.