USD/JPY weekly
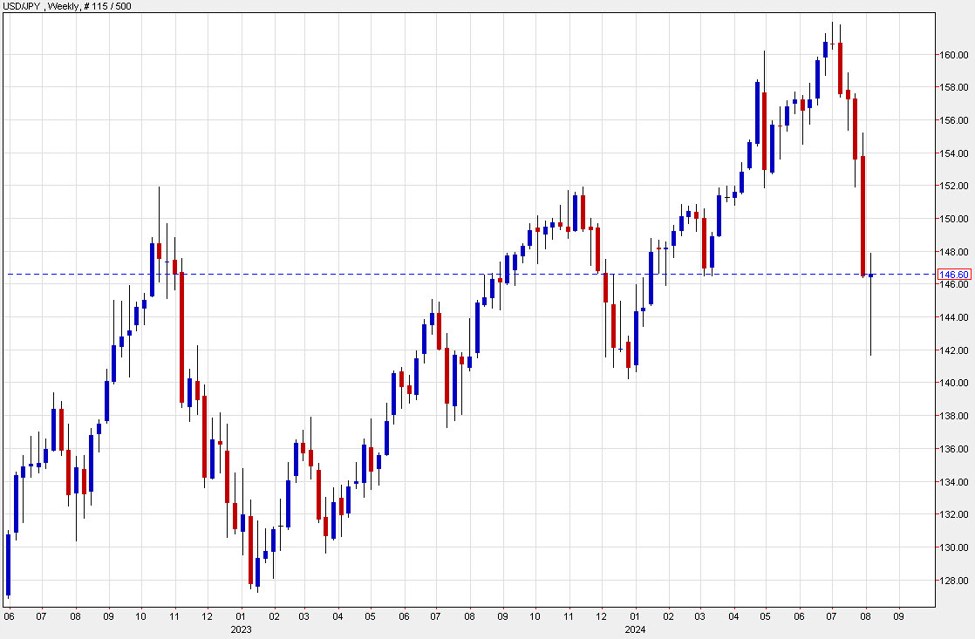
What’s in a 19-pip move?
That’s the total change in USD/JPY on the weekly chart. Of course it doesn’t tell the whole story, not even close. The pair cratered after hitting a 34-year high last month and had fallen more than 20 big figures by Monday.
The drop came as the carry trade collapsed and that spiralled into the largest one-day loss in Nikkei 225 history. It also rattled global markets, sending shockwaves nearly everywhere.
Market began to calm Tuesday, in part due to the Bank of Japan signalling that it was done raising interest rates — essentially giving the ‘all-clear’ for traders to re-enter and re-inflate the bubble.
That reversal-in-position plus the incredibly oversold conditions led to a quick rebound in the pair that was cruising along until the past few hours when there was some selling, in part because US Treasury yields have fallen hard and completely shaken off inflation fears. It’s a mixed picture but the US economy slowing is part of the story in the drop in this pair and is likely to tell the next chapter in this pair.
In the week ahead we get CPI and retail sales data from the US and if the message is a further economic slowdown then we could see this stalemate quickly broken. If the US consumer digs deep again and broad risk sentiment stays upbeat, then we could quickly be back at 150.00.
Technically, the big doji candle on the weekly chart raises the possibility of a further reversal and that’s good bet given on how far things have moved but it only works in a benign risk environment.