Bitcoin prices are moving sideways when writing and are generally firm. Even though there are marks of strength, the world’s most valuable coin is still swimming against ferocious downstream currents and could risk plunging below $60,000 and May 2024 lows.
Is The Bitcoin Bear Run Over? Prices Retest The 100-Day Moving Average
Though there are risks, one analyst on X is upbeat. In a post, the trader noted that prices have retested the 100-day moving average. Historically, whenever Bitcoin has dipped to or slightly below this level, it has marked a local bottom, followed by a significant upward rally.
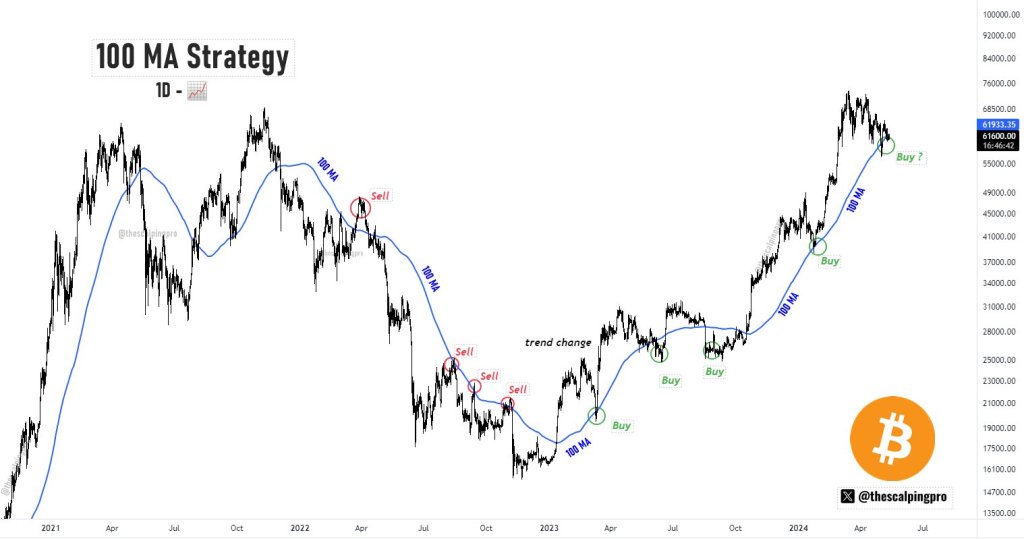
Looking at the daily chart, the analyst notes that the most recent instance occurred in January, where a price test of the 100-day moving average preceded a 90% surge.
Now that prices have once more retested this level, if history guides, it is likely that Bitcoin has found a local bottom, and a bullish outcome, last seen in January 2024, could be on the offing.
Though traders are hopeful, there is no guarantee that prices will surge as expected. As mentioned earlier, the coin remains under immense liquidation pressure, and sellers have been soaking in attempts for higher highs.
The daily chart shows local resistance and support are at $66,000 and $56,500, respectively. As prices move sideways, the trend direction established will largely depend on the breakout direction.
A conclusive close above $66,000, buoyed by rising participation, might surge BTC prices. However, whether it will spike by 90% or higher like in the past remains to be seen.
Inflation Data: A Catalyst For Bitcoin Growth?
With traders upbeat, this week promises to be pivotal, with inflation data taking center stage. On May 14, the United States Producer Price Index (PPI) will be released. A day later, on May 15, the public will know where the Consumer Price Index (CPI) reading stands.
While economists anticipate a slight decrease in inflation compared to previous readings, volatility is expected. If inflation slows down in the United States, the greenback could weaken. Subsequently, Bitcoin may edge higher as investors seek alternatives to store value.
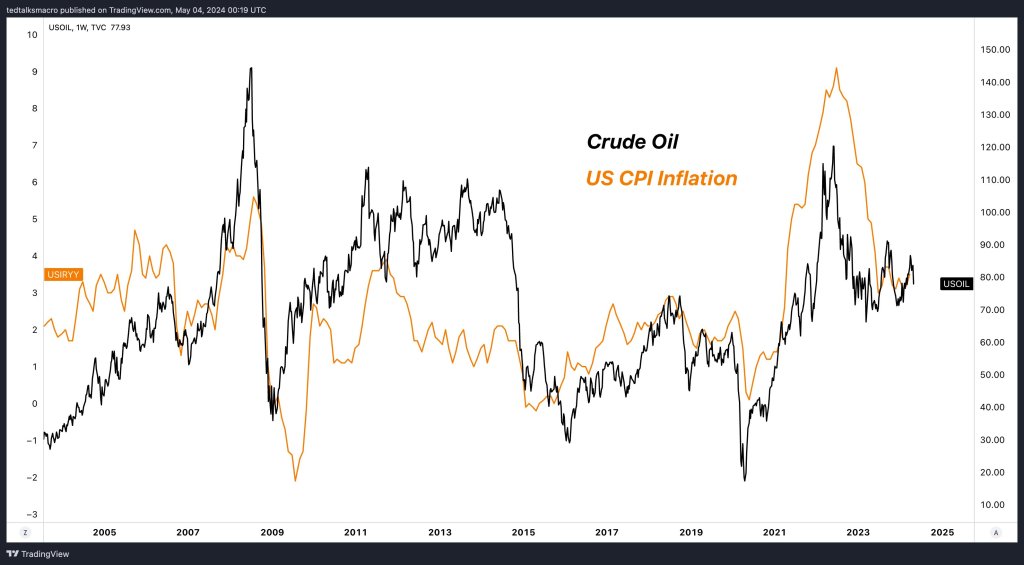
In a post, one analyst believes falling oil prices and a robust labor market point towards an overall softening of inflation in the United States. If this trend guides, it aligns well with the expectation of lower PPI and CPI readings this week; a net bullish for BTC.
Feature image from Canva, chart from TradingView