
Bitcoin (BTC) is navigating through a storm of fear and uncertainty, with recent volatile price action causing significant shakeouts among traders and investors. Since August 24, BTC has experienced a sharp retrace of over 12%, plunging below the $60,000 mark—a crucial psychological level that often serves as a pivot point for both price action and market sentiment.
As BTC fluctuates, parallels are drawn between its current structure and the 2016 bull market. With historical patterns suggesting a potential breakout, the question on everyone’s mind is whether Bitcoin is poised for a repeat of its past performance. As the market watches closely, the coming weeks could reveal if BTC will surge to new heights or face further challenges.
Bitcoin 2024 vs. 2016: A Comparison
Bitcoin is engulfed in doubt, with investors feeling increasingly desperate as the cryptocurrency enters an unexpected consolidation phase. While unsettling, this period of price stagnation is not unheard of in Bitcoin’s history. Top crypto analyst and investor Stockmoney Lizards has drawn an insightful comparison between BTC’s current price action and the 2016 bull run.
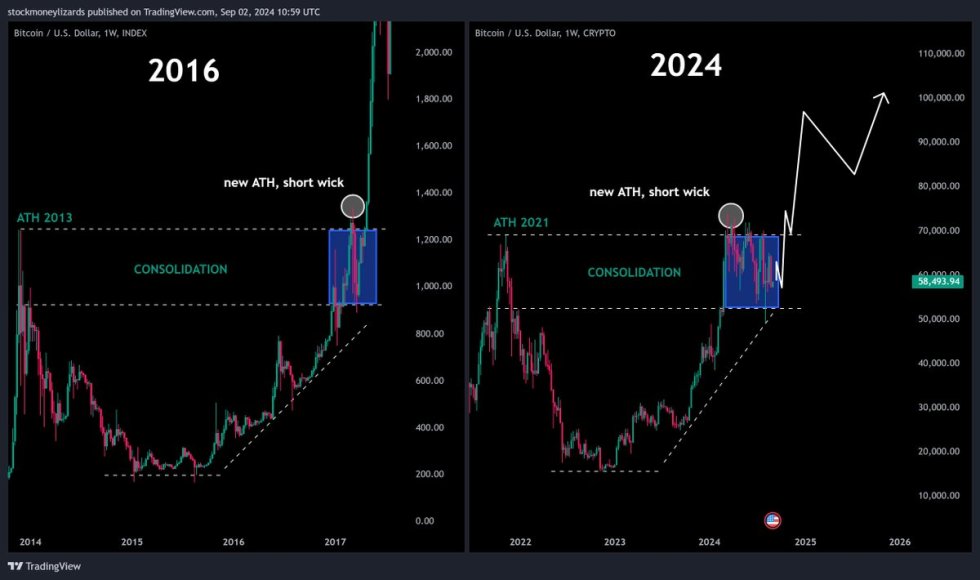
2016 Bitcoin briefly surpassed its 2013 all-time high (ATH) but only managed a small wick above it, much like this year’s ATH. Following that brief peak, Bitcoin underwent a substantial correction before embarking on a dramatic surge that set new highs in 2017. This historical analogy fuels hope among investors who see a similar pattern emerging now.
Stockmoney Lizards notes that while a repeat of the 2016 vertical ascent is unlikely due to Bitcoin’s larger market cap in 2024, he remains optimistic. His target for Q4 is a significant milestone of $100,000. Although the current consolidation phase might test investor patience, the historical context provides a glimmer of hope for a potential bullish breakout. As Bitcoin navigates this turbulent period, all eyes are on whether the market will mirror past successes or chart a different course.
BTC Price Consolidation
Bitcoin trades at $58,910, reflecting a week of uneventful price action and an ambiguous low-timeframe structure. The cryptocurrency is positioned below the 4-hour 200 moving average (MA) at $59,892, a key short-term strength indicator. Since early August, BTC has appeared magnetically drawn to the $59,000 level, testing it almost daily since August 8.

For the bulls to regain control, Bitcoin must reclaim the 4-hour 200 MA and break above the $60,000 mark. Such a move would set the stage for a potential rally towards the local high of $65,103. Conversely, if Bitcoin fails to hold the $57,000 support level, a further decline could be on the horizon.
This pivotal support level will be crucial in determining the near-term direction of Bitcoin’s price action. As the market grapples with these critical levels, investors will closely watch for signs of a bullish reversal or a bearish continuation.
Featured image from Dall-E, chart from TradingView