Klaus Vedfelt
Thesis
When you look at the capital markets and identify what has performed in 2024, momentum strategies stand out. Despite the complex sounding moniker, momentum equities strategies are not hard to understand, and have performed very robustly historically.
JPMorgan U.S. Momentum Factor ETF (NYSEARCA:JMOM) is an equities ETF that follows a momentum strategy via the JPMorgan US Momentum Factor Index. In this article, we are going to have a detailed look at the ETF and its underlying index, and articulate why we believe the momentum factor is an appealing risk to put in a portfolio currently.
What exactly is momentum investing?
Retail investors might be familiar with equity market sectors, such as Technology, Energy or Utilities, and with large indices such as the S&P 500, the Nasdaq or the Dow Jones. Alongside this parsing lies another one, based on a different allocation, namely risk factors:
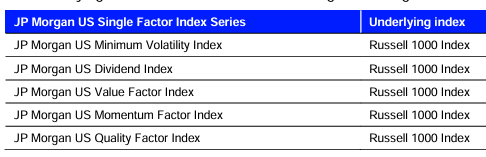
Factors (Index fact sheet)
JPMorgan has a number of indices outstanding that take advantage of said factors, with a minimum volatility index, a dividend index and a momentum factor one.
As per its definition, momentum investing is:
a strategy that aims to capitalize on the continuance of an existing market trend. It is a trading strategy in which investors buy securities that are already rising and look to sell them when they look to have peaked. Momentum, in markets, refers to the capacity for a price trend to sustain itself going forward.
Momentum investing is the complex translation of the simple phrase ‘the trend is your friend’. The JPMorgan US Momentum Factor Index tries to achieve just that, via a methodology based systematic approach.
How does the Momentum Factor Index work?
As mentioned above, the underlying pool of equities is constituted by the Russell 1000 Index portfolio. Those equities are then ranked based on a simple momentum equation:
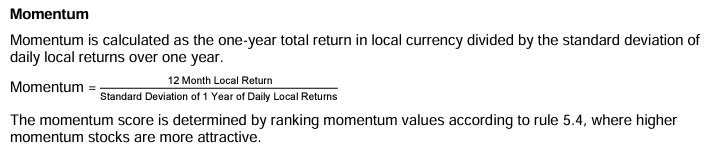
Momentum Index Definition (Index Prospectus)
For the purpose of this ETF and Index, momentum is defined as 12-months returns divided by the 12-months standard deviation of those returns. In essence, the index is trying to capture the names which are steadily moving upwards.
When the equation above yields the same results for equities, then liquidity and market capitalization are used to rank them:
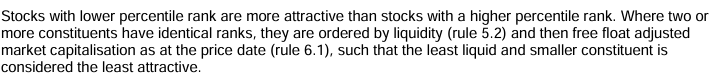
Composition (Index Prospectus)
The ETF (mirroring the index) is currently holding 278 names, with a high turnover ratio of 43%. Expect a high turnover ratio for this ETF since the fund will kick out those names where momentum is abating. Unlike other names, a high turn-over here is not a negative.
Current holdings
The fund’s top holdings will look familiar:
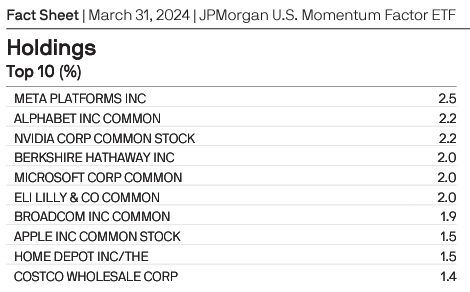
Top Holdings (Fund Website)
Some of the mega cap tech names are there, but kindly notice the absence of Tesla (TSLA) where the momentum factor turned negative earlier in the year. The top names will continue rotating, as per the described methodology.
From a sectoral standpoint, please find below the current composition:
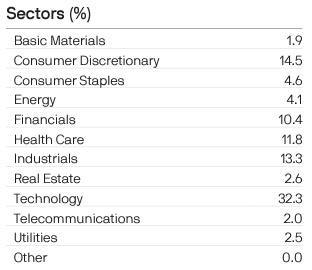
Sectors (Fund Website)
For the current composition, Technology holds the largest representation, followed by the Consumer Discretionary sector.
Also, kindly keep in mind that standard valuation methodologies do not apply in the same way for a momentum fund. From a P/E ratio perspective, the name is expensive:
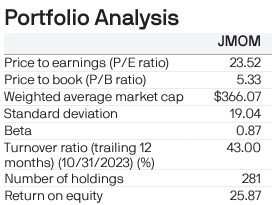
Portfolio Metrics (Fund Website)
However, choosing attractively valued equities is not what this fund will do. The ETF will select equities with momentum, where the trend is pointing upwards, regardless of valuation. The best example is NVIDIA (NVDA), where valuation metrics have been through the roof for many months, yet the name kept climbing.
Via JMOM an investor is just following the strongest names in the market. An investor is not purchasing the best priced names, or the most conservative sectors, but an investor is just going with the allocation flow currently present in the market.
Robust performance via trend following
Momentum as a portfolio composition factor has done really well in 2024:
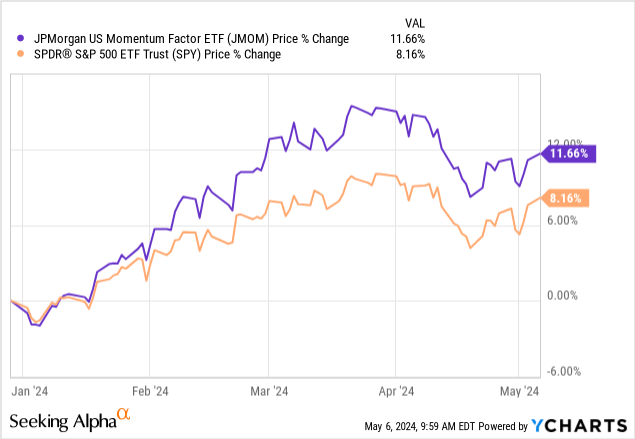
JMOM is up 11.6% this year, all while the SPY is up 8%. Historically, momentum has shadowed the SPY, with an outperformance during the 2020/2022 zero rates environment:
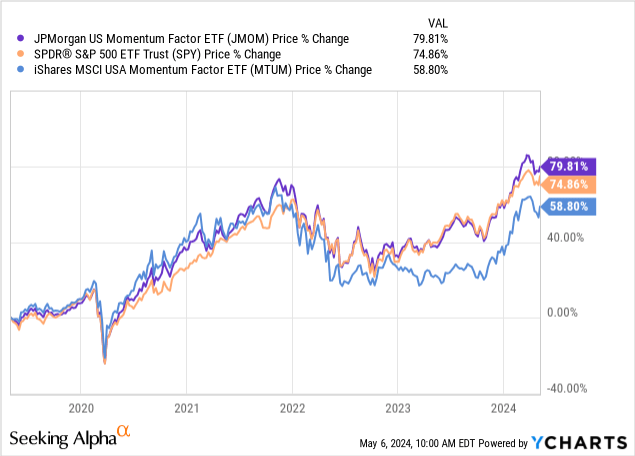
We have plotted on this graph another momentum ETF, namely the iShares MSCI USA Momentum Factor ETF (MTUM), the better known momentum ETF that has an AUM of $9.7 billion. MTUM has lagged both JMOM and the SPY during the 2022/2023 period.
Unsurprisingly, the ETF also comes with similar drawdown to the SPY, and a standard deviation of 19%. Its 3-year Sharpe ratio is 0.32 and its beta is 1.05 also on the same look-back period.
Historically, the fund beats the S&P 500 during those years where financial conditions are easing, thus providing strong momentum to equities:
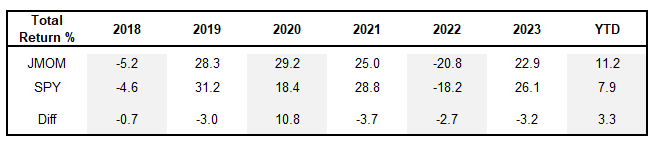
Returns (Author / Morningstar)
The largest outperformance for JMOM was recorded in 2020 when rates moved to zero. Year to date, the fund is also doing better than the index, as the market is pricing in rate cuts.
With financial conditions continuing to ease in 2024, JMOM should also have an outstanding year, outperforming the S&P 500:
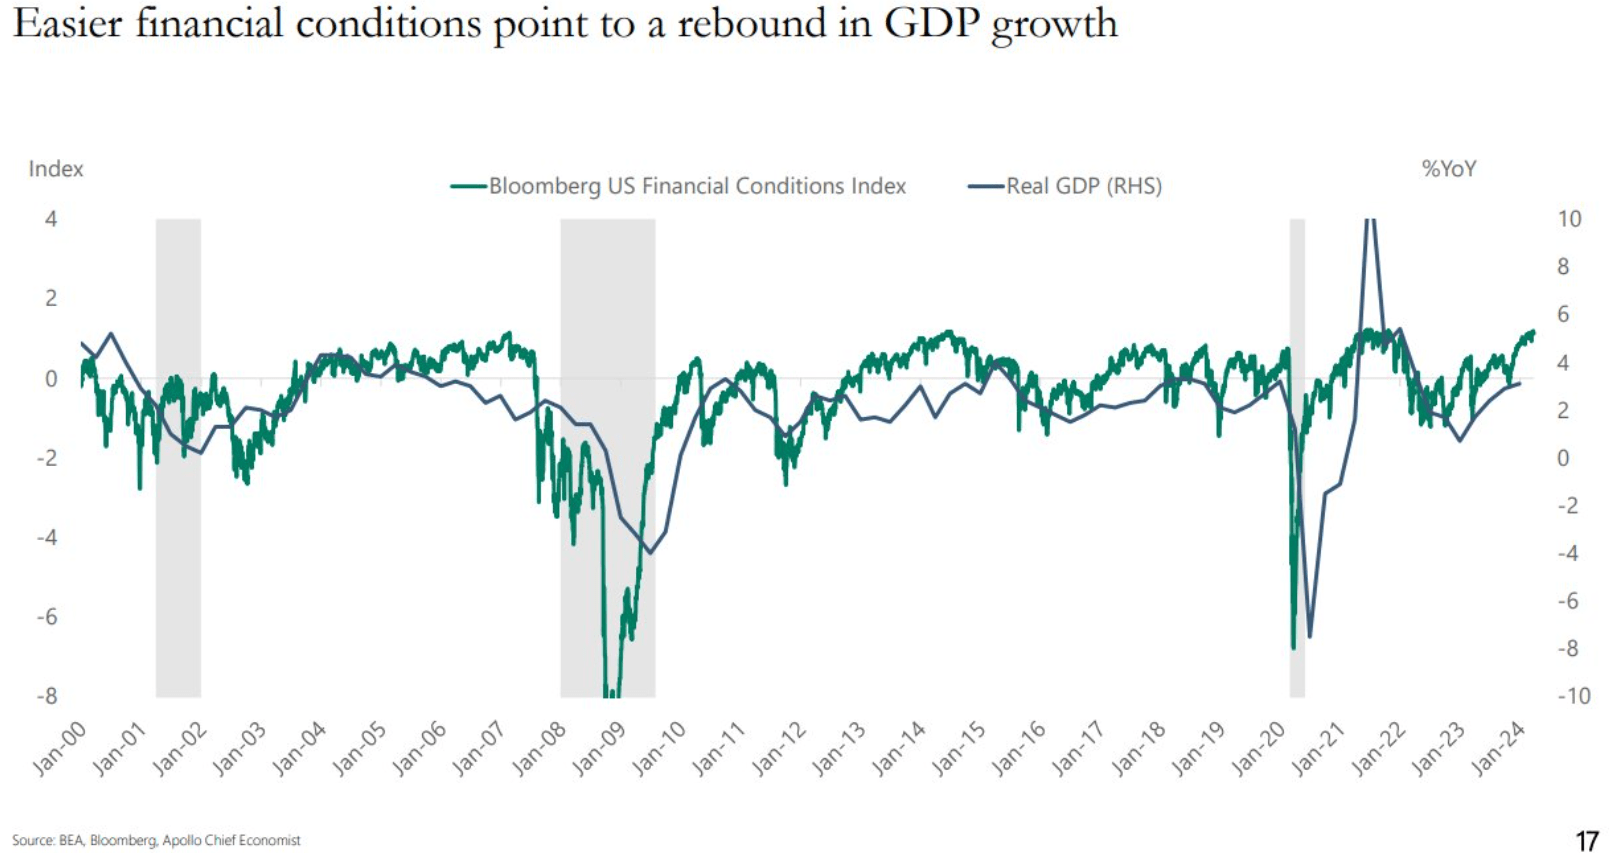
Financial Conditions (Apollo)
In the above graph, the green line represents the Bloomberg US Financial Conditions, and the line moving up means conditions are improving. As the Fed cut rates in 2020, for example, the green line moved higher. Similarly, in 2022, when rates were raised, financial conditions became tighter with the green line moving down. JMOM underperformed the SPY in 2022.
The best way to think about JMOM is as a momentum overlay on the SPY. Over very long periods of time, the two ETFs will have similar performances, but during the cycles when financial conditions ease up, JMOM will outperform. Conversely, during cycles of monetary or fiscal tightening, JMOM will underperform based on its history.
The fund is not a high beta take on the SPY, or a vehicle where growth factors are used to select stocks. It simply represents a trend following vehicle that tends to outperform when investors chase a sub-population of the index.
Conclusion
JMOM is an equities ETF from JPMorgan that comes with a 12 bps expense ratio. The fund employs a momentum strategy, trying to capture equities in an uptrend from the Russell 1000 Index. Unlike traditional sectoral funds, the ETF will have a high turnover as it constantly gravitates to names in an uptrend. The ETF does best in environments where financial conditions are easing, and has outperformed the SPY during those periods. On a very long term basis the ETF posts similar results to the S&P 500. Traditional valuation metrics are not that important for the name since it switches its composition as certain individual stocks become the focus of the market. The ETF is outperforming the SPY by roughly 3% so far in 2024, and we expect this trend to continue.