
In the ever-evolving world of cryptocurrency assets, determining Bitcoin’s peak has always been a major discussion and challenge in the industry as the bull cycle continues to pick up pace. However, a market expert analyzing BTC’s performance and key metrics has predicted that the digital asset is still far from reaching this ongoing cycle peak.
Bitcoin Is Distant From This Cycle’s Top
Recent data from the Bitcoin Onchained index reveals that BTC could have a long way to go before hitting its cycle’s top, indicating that the flagship crypto asset has a large upside potential following a steady price recovery in the last few days. This index, which usually monitors important indicators such as market trends, long-term holder attitude, and network activity, suggests that Bitcoin appears to be in an accumulation period rather than approaching a market peak.
Kyle Doops, a market expert and host of Crypto Banter, shared the development on the X (formerly Twitter) platform. According to the expert, the Onchained index is a state-of-the-art tool that utilizes investors’ behavior research to identify highs and lows in the BTC market.
Currently, Kyle Doops highlighted that the index is showing that BTC is still far from topping out in this ongoing bull cycle and demonstrating that price could still rise by about 2x to 3x before reaching its peak. Considering the current value of BTC, this 2x to 3x growth puts the coin between $127,000 and $191,000 at the end of the bull run.
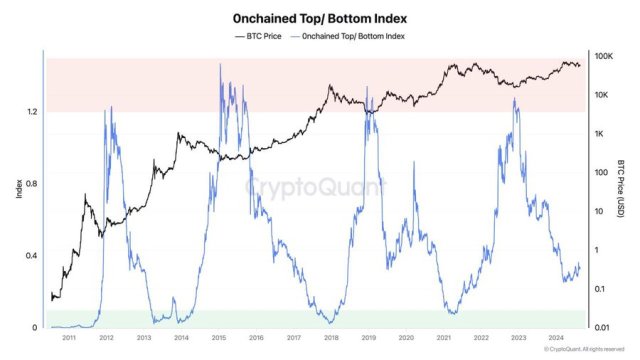
The expert considers the index as a trusted gauge for savvy investors, given its reliable and accurate performance for the past 13 years. As the largest cryptocurrency asset continues to recover its value, this index offers an optimistic outlook for the future trajectory of Bitcoin.
The post read:
The “0nchained Index” is a cutting-edge tool pinpointing #Bitcoin market highs and lows through investor behavior analysis. Right now, it signals we’re far from the peak, hinting at a potential 2x to 3x price surge. With a track record of accuracy since 2011, it’s a trusted gauge for savvy investors.
In another X post, Kyle Doops also delved into the Short-term Holders Market Value to Realized Value (STH-MVRV) ratio for Bitcoin, which has recently fallen below 1.0. The drop in the STH-MVRV ratio simply means that new investors are holding losses.
As seen by this month’s Bitcoin crash triggered by Japan’s Stock Market downswing, this development, which is marked by unrealized losses, could sharpen selling pressure and raise the likelihood of panic and capitulation among these short-term holders.
BTC’s Price Rebounds Strongly
After consolidating between the $58,000 and $60,000 price level for a while, BTC has finally broken out of the zone hitting the $65,000 on Sunday. With this renewed price momentum, the crypto asset could be poised for further gains in the upcoming days.
Although BTC’s price today has fallen to about $63,800 due to strong resistance faced at the $65,000 level, it is still up by over 8% in the past week, according to data from CoinMarketCap. Despite the increase in price, its market cap and trading volume are down by 0.32% and 4.38% in the past day.
Featured image from iStock, chart from Tradingview.com