digitalmazdoor digitalmazdoor
The Lazard Global Total Return and Income Fund Inc (NYSE:LGI) is a closed-end fund, or CEF, that is designed to provide investors with both global diversification and a high level of income. The fact that this is a global fund will undoubtedly appeal to anyone who is seeking to reduce their exposure to the United States and especially the United States dollar.
Recent projections from the Congressional Budget Office reveal how important it is to diversify your portfolio across nations and currencies, as these projections point to considerable fiscal deficits going forward that seem almost certain to reduce the strength of the U.S. dollar compared to other currencies. Central banks all over the world have started to realize this, with central bank gold purchases setting a record in 2022 and almost matching that level in 2023.
The high fiscal deficits in the United States will also eventually crowd out the private sector and could result in better growth and investment opportunities elsewhere in the world. The global focus of the Lazard Global Total Return and Income Fund allows it to take advantage of the best investment opportunities available worldwide, instead of only those that are found in a single country.
The fund does not disappoint in the income category either, as it boasts a 7.56% yield at the current price. This is obviously substantially higher than the yield of the major American indices:
Wall Street Journal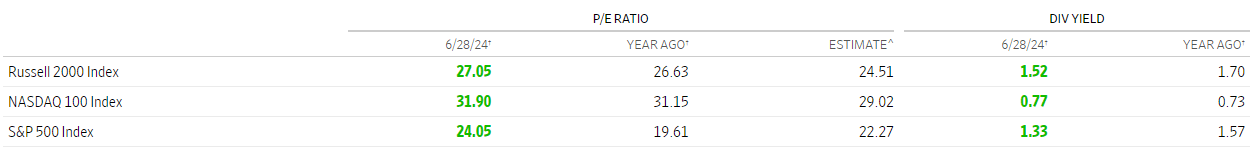
As we can clearly see, the S&P 500 Index (SP500) only has a 1.33% yield right now. That is nowhere near enough to appeal to anyone who is seeking to earn a high level of income from their portfolio. The global indices are not much better, as the iShares MSCI World ETF (URTH) only has a trailing twelve-month yield of 1.54%.
However, the current yield of the Lazard Global Total Return and Income Fund is not particularly impressive when compared to its peers:
|
Fund Name |
Morningstar Classification |
Current Yield |
|
Lazard Global Total Return and Income Fund |
Equity-Global Equity |
7.56% |
|
Allspring Global Dividend Opportunity Fund (EOD) |
Equity-Global Equity |
9.14% |
|
Calamos Long/Short Equity & Dynamic Income Fund (CPZ) |
Equity-Global Equity |
11.07% |
|
Clough Global Equity Fund (GLQ) |
Equity-Global Equity |
10.34% |
|
Eaton Vance Tax-Advantaged Global Dividend Income Fund (ETG) |
Equity-Global Equity |
8.32% |
|
abrdn Total Dynamic Dividend Fund (AOD) |
Equity-Global Equity |
8.25% |
As we can clearly see, the Lazard Global Total Return and Income Fund cannot even compare with many of the other funds in the sector that employ a similar strategy. The fund has the lowest yield among any of the other closed-end funds shown on the chart. This will, unfortunately, reduce the fund’s appeal among those who are trying to maximize their incomes. However, as I have pointed out various times in the past, we usually do not need to worry too much about a distribution cut when a fund yields substantially less than its peers. We will discuss that in greater detail over the remainder of this article, but this might appeal to more risk-averse investors.
As regular readers might remember, we previously discussed the Lazard Global Total Return and Income Fund back in March 2024. The global equity markets have generally been pretty strong since that time, so we can probably expect that the fund will have delivered a pretty strong performance since the previous article was published. This is relatively true, but the fund still only delivered a 2.15% gain over the period:
Seeking Alpha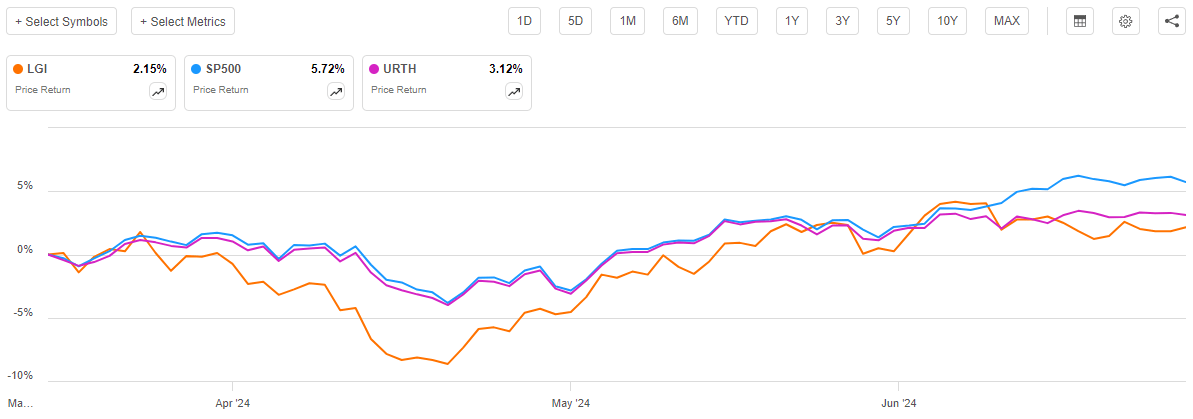
We can see that this fund underperformed both the S&P 500 Index and the MSCI World Index over the period. However, its underperformance relative to the MSCI World Index was only by 97 basis points, which is not really a large amount over a three-month period. Income-focused investors are sometimes willing to accept a small amount of underperformance in exchange for a high yield, so this is a trade-off that some investors might be okay with.
However, as I stated in a recent article:
Closed-end funds typically pay out most or all of their investment profits to their investors in the form of distributions. The basic objective is to keep the portfolio relatively stable in size while giving the investors all of the profits. This differs somewhat from an exchange-traded fund that rarely has any realized capital gains and depends primarily on share price appreciation to reward its investors. The fact that these funds pay out all of their investment profits is the reason why they tend to have higher yields than just about anything else in the market. It also results in shareholders doing much better than the price performance alone would suggest. Therefore, we need to include the distributions that the fund pays out in any discussion of its performance.
When we include the distributions that the Lazard Global Total Return and Income Fund paid out over the past three months, we get this alternative to the chart above:
Seeking Alpha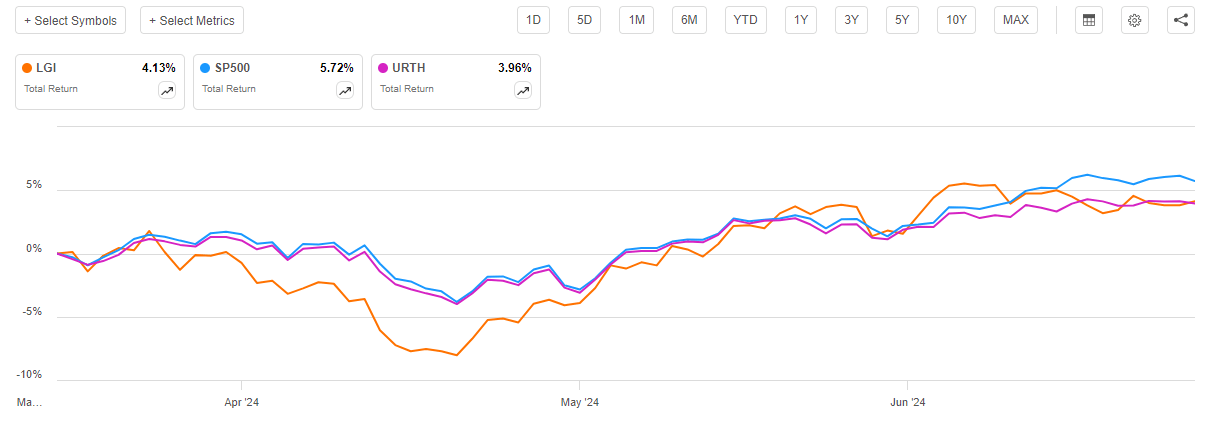
As we can see here, the fund distributed enough money over the period to result in it actually outperforming the MSCI World Index on a total return basis. The fund still trailed the S&P 500 Index, though, which is unfortunate. As we all know, though, American capital markets have generally outperformed foreign ones over most of the past fifteen years, so it is unlikely to be surprising that a global fund trailed the S&P 500 Index.
As three-and-a-half months have passed since we last discussed the Lazard Global Total Return and Income Fund, we can expect that a great many things have changed. This article will focus specifically on those changes and attempt to determine if it makes sense to purchase it today or if we need to update our thesis.
About The Fund
According to the fund’s website, the Lazard Global Total Return and Income Fund has the primary objective of providing its investors with a very high level of total return. This makes a great deal of sense given the fund’s strategy, which is explained on the website:
Lazard Global Total Return & Income Fund is a closed-end investment company that seeks total return consisting of capital appreciation and current income. The Fund seeks to achieve its objective by investing in a portfolio of approximately 60-80 US and non-US equity securities, generally with a market cap of $2 billion or greater, at the time of purchase, and may invest in emerging markets. It seeks enhanced income by investing in short-duration (typically below one year) emerging market forward currency contracts and other emerging market debt instruments.
As I stated in the previous article, common equities are by their nature total return vehicles:
Common equities are by their nature total return vehicles. After all, investors typically purchase common equities both to receive an income via the dividends that these securities pay out as well as benefit from the capital gains that should accompany the growth and prosperity of the issuing company.
Thus, any fund that invests primarily in common equities should have the provision of total return as its primary objective. While the fund’s website description does strongly imply that the portfolio will consist primarily of common equities, it does omit some details that would be nice to know:
- Does the fund have a mandate as to the percentage of its assets that will be invested in the United States versus foreign countries?
- What percentage of its assets will such things as the forward currency contracts and emerging market debt instruments constitute?
- Does the fund try to diversify across different industry sectors, or can management simply invest wherever it thinks returns will be the highest?
- Does the fund hedge currency exposure, or are investors getting unhedged exposure?
A few of these questions are pretty important, depending on what your goals are for international diversification. In particular, investors who expect that the U.S. dollar will decline going forward may favor unhedged currency exposure and prefer that the fund be invested in assets that are priced in foreign currency. Personally, I am in this group and have found it very difficult to find any global funds with unhedged currency exposure. Indeed, most global funds have well over 50% of their assets invested in the United States (the abrdn funds are perhaps the exception to this).
The Lazard Global Total Return and Income Fund does not appear to be an exception to my statement about having a high allocation to the United States. The fact sheet provides the following asset allocation:
Fund Fact Sheet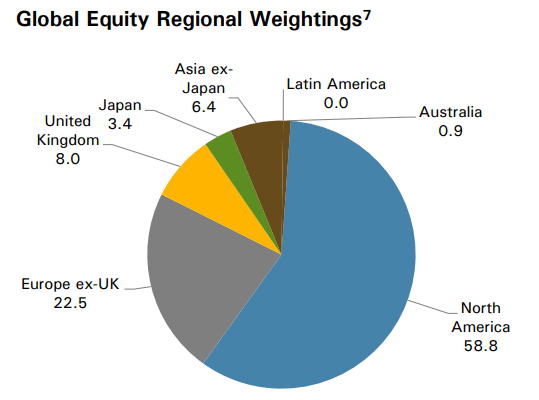
We notice immediately the 58.8% weighting to North America. That includes both the United States and Canada, but almost any fund that combines the two together into a single region will have almost all of its North America weighting invested in U.S. assets. Canada is typically an afterthought for funds like this. The first quarter 2024 holdings report appears to support this assumption, as it only lists three Canadian companies:
(all figures are Canadian dollars.)
Only National Bank of Canada accounts for more than 2% of the portfolio. We can see this clearly by looking at the largest positions in the portfolio:
Fund Fact Sheet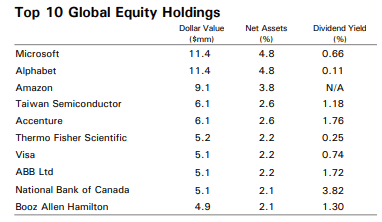
We can see clearly that National Bank of Canada is 2.1% of the portfolio. That would give the portfolio as a whole a value of CAD$322,132,619, which then results in the following weights for the three Canadian companies:
|
Company Name |
% of Net Assets |
|
Dollarama |
1.35% |
|
National Bank of Canada |
2.10% |
|
Toromont Industries |
1.43% |
Please note that these weightings will not be exact, especially since we have timing issues here. The fact sheet that provides the top ten holdings was dated May 31, 2024, but the first-quarter holdings report was dated March 31, 2024. Thus, there is no guarantee that the stocks moved perfectly with the portfolio, and the weightings may not be perfectly correct, but either way we can make an estimate that the fund’s allocation to Canada is just under 4%. That puts the percentage of the portfolio invested in the United States at somewhere around 55%. This is more than we would really like to see from a global fund. Indeed, as some readers might remember, over the past few weeks we have discussed quite a few global funds that had an American allocation of around 49% or so. Thus, investors who place a priority on having exposure to foreign assets while reducing their American exposure might be happier elsewhere.
There have been a number of changes since we last discussed the fund, which suggests that the fund is engaging in a great deal of trading activity. After all, only three months have passed since our last discussion. The changes to the fund’s largest positions list are that RELX (RELX), Wolters Kluwer (OTCPK:WOLTF), and Motorola (MSI) were removed from the fund’s largest position list. In their place, we have Taiwan Semiconductor (TSM), National Bank of Canada, and ABB (ABB). This represents the removal of two UK-domiciled companies (Relx and Wolters Kluwer) for three foreign companies:
|
Company Name |
Country of Origin |
|
Taiwan Semiconductor |
Republic of China |
|
National Bank of Canada |
Canada |
|
ABB |
Sweden |
The changes thus appear to represent a shift from the United States to foreign nations, which we can probably appreciate as it supports our thesis of diversifying our assets internationally. However, there is no guarantee that this is the case due to the simple fact that American assets have outperformed global stocks, as is evidenced by the fact that the S&P 500 Index outperformed the MSCI World Index since the time of our last discussion.
We saw this in the introduction. We also see that Alphabet’s (GOOGL) weighting in the fund’s portfolio increased significantly from the 4.1% that it had at the time of our last discussion. Amazon’s (AMZN) weighting also increased over the period, going from 3.5% of net assets back in March to 3.8% of net assets today. However, Microsoft’s weighting remained stable at 4.8% of net assets. Therefore, it appears that we are seeing a scenario where the fund’s management is trying to maintain its global exposure by moving assets into foreign stocks, but the strong performance of the American mega-cap technology companies is partially thwarting these efforts.
I just speculated that the fact that we see three changes to the fund’s largest positions in as many months could mean that this fund has a very high annual turnover. However, that was not the case last year, as the 2023 annual report puts its full-year turnover at 5% for that year. This year appears to be an outlier, though, as the fund’s annual turnover has been higher most years:
|
FY 2023 |
FY 2022 |
FY 2021 |
FY 2020 |
FY 2019 |
|
|
Portfolio Turnover |
5% |
15% |
16% |
23% |
29% |
The fact that the fund changed three of its largest positions in just the last three months does suggest its turnover for the 2024 fiscal year will be higher than 5%. It is far too early to make a guess about whether it will come in higher than it had in 2019 or 2020, though.
The Lazard Global Total Return & Income Fund has a much lower turnover than many of its peers:
|
Fund Name |
Portfolio Turnover |
|
Lazard Global Total Return and Income Fund |
5.00% |
|
Allspring Global Dividend Opportunity Fund |
97.00% |
|
Calamos Long/Short Equity & Dynamic Income Fund |
210.00% |
|
Clough Global Equity Fund |
122.00% |
|
Eaton Vance Tax-Advantaged Global Dividend Income Fund |
101.00% |
|
abrdn Total Dynamic Dividend Fund |
78.00% |
(all figures from the most recently released annual report for each respective fund.)
We can certainly see that, in general, the Lazard Global Total Return & Income Fund is engaging in less trading actually than similar funds. This should be good from an expense perspective, as it should result in the fund having to shell out less money for trading costs than most of its peers. Indeed, this fund’s costs are fairly reasonable at 2.32%:
|
Fund Name |
Expense Ratio |
|
Lazard Global Total Return and Income Fund |
2.32% |
|
Allspring Global Dividend Opportunity Fund |
2.98% |
|
Calamos Long/Short Equity & Dynamic Income Fund |
4.52% |
|
Clough Global Equity Fund |
5.60% |
|
Eaton Vance Tax-Advantaged Global Dividend Income Fund |
2.70% |
|
abrdn Total Dynamic Dividend Fund |
1.19% |
(All figures are for the most recently completed fiscal year for each respective fund.)
As we can see, the Lazard Global Total Return & Income Fund has a lower expense ratio than all except for one of its peers. Those investors who are highly focused on costs will probably appreciate this, as a lower expense ratio means that more of the fund’s investment profits can make their way down to investors.
Leverage
As is the case with most closed-end funds, the Lazard Global Total Return & Income Fund employs leverage as a method of boosting the effective total return that it earns from the assets in its portfolio. I explained how this works in my previous article on this fund:
In short, the fund borrows money and then uses those borrowed monies to purchase stocks and other assets. As long as the total return of the purchased securities is greater than the interest rate that the fund has to pay on the borrowed money, the strategy works pretty well to boost the overall yield of the portfolio. This fund is capable of borrowing money at institutional rates, which are considerably lower than retail rates. As such, this will usually be the case.
However, the use of debt in this fashion is a double-edged sword. This is because leverage boosts both gains and losses. As such, we want to ensure that the fund is not employing too much leverage because that would expose us to too much risk. I generally do not like to see a fund’s leverage exceed a third as a percentage of its assets for that reason.
As of the time of writing, the Lazard Global Total Return & Income Fund has leveraged assets comprising 31.40% of its portfolio. That represents an increase over the 29.74% leverage ratio that the fund had the last time that we discussed it. This is admittedly rather surprising considering that the share price gained over the period. Normally, when the portfolio gets larger, the leverage ratio declines.
The solution to this problem can be found very simply by looking at the fund’s net asset value. This chart shows how it has performed since the March 13, 2024, publication date of the previous article on this fund:
Barchart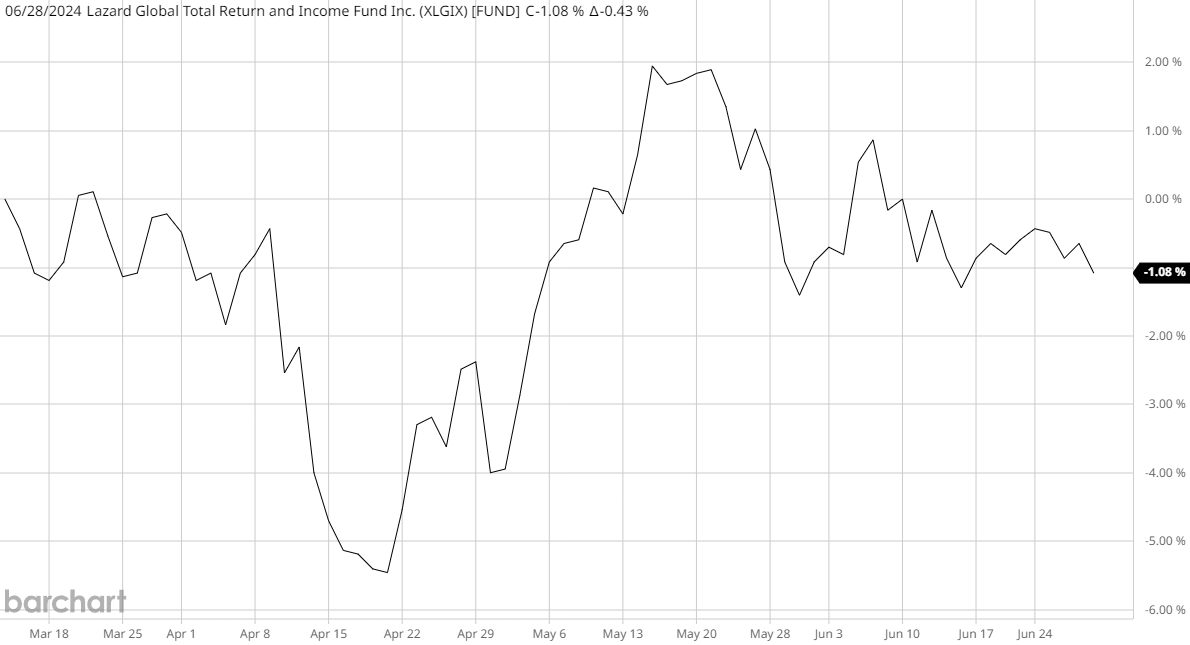
As we can immediately see, the fund’s net asset value declined by 1.08% over the intervening period. The share price, meanwhile, went up, which immediately tells us that the fund is currently more expensive than it was a few months ago. We will discuss this in more detail later in this article. For now, the important thing to note is that the portfolio is actually smaller than it was back in March 2023. Therefore, the fund’s outstanding borrowings represent a larger percentage of a smaller portfolio than they did a few months ago, all else being equal. That is precisely what we see here.
The Lazard Global Total Return & Income Fund is currently employing a higher level of leverage than its peers:
|
Fund Name |
Leverage Ratio |
|
Lazard Global Total Return and Income Fund |
31.40% |
|
Allspring Global Dividend Opportunity Fund |
17.10% |
|
Calamos Long/Short Equity & Dynamic Income Fund |
25.62% |
|
Clough Global Equity Fund |
28.69% |
|
Eaton Vance Tax-Advantaged Global Dividend Income Fund |
17.74% |
|
abrdn Total Dynamic Dividend Fund |
5.37% |
(all figures from CEF Data.)
The fact that the Lazard Global Total Return & Income Fund has higher leverage than its peers could be a sign that the fund is using too much leverage given its particular strategy. This is something that could prove problematic for those risk-averse investors who do not want the funds in their portfolio to move around too much. Of course, the fund’s leverage ratio is still well below the one-third of assets levels that we would normally find acceptable, so it is probably okay.
Distribution Analysis
The primary objective of the Lazard Global Total Return and Income Fund is to provide its investors with a high level of total return. However, like most closed-end funds, it pays out the majority of its investment profits to its shareholders in the form of distributions. To this end, the fund pays a monthly distribution of $0.1046 per share ($1.2552 per share annually). This gives the fund a 7.56% yield at the current price. As we saw in the introduction, this yield is quite a bit lower than that of many of its peers, but it is still very attractive compared to most indices.
Unfortunately, the Lazard Global Total Return & Income Fund has not been especially consistent regarding its distributions over the years:
CEF Connect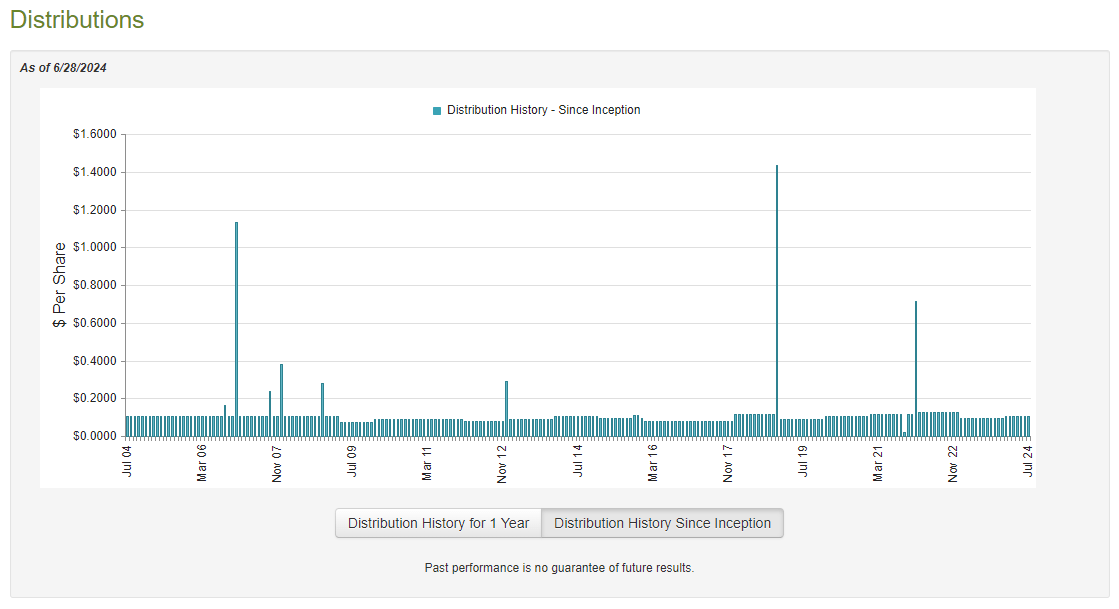
As I stated in the previous article on this fund:
The distribution history might prove to be something of a turn-off for those investors who are seeking a safe and secure income to use to cover their bills or finance their lifestyles. After all, it is much more difficult to budget your spending activities when your income can change significantly from period to period, as investors in this fund tend to experience. However, at the same time, it is natural for many closed-end funds to change their distributions on a regular basis to correspond to the actual performance of their portfolios. This generally ensures that the fund is not paying out more money than it can actually afford and destroys its net asset value in the process. The more a fund’s net asset value is depleted, the worse its sustainability going forward and the harder it is for the fund to meet a specified level of distribution.
As we saw the last time that we discussed this article, the Lazard Global Total Return & Income Fund easily covered its distributions for the full-year 2023 period. The fund has not released an updated financial report since the date the previous article was published, so there is no sense in repeating the analysis here.
The Lazard Global Total Return & Income Fund raised its distribution in January:
CEF Connect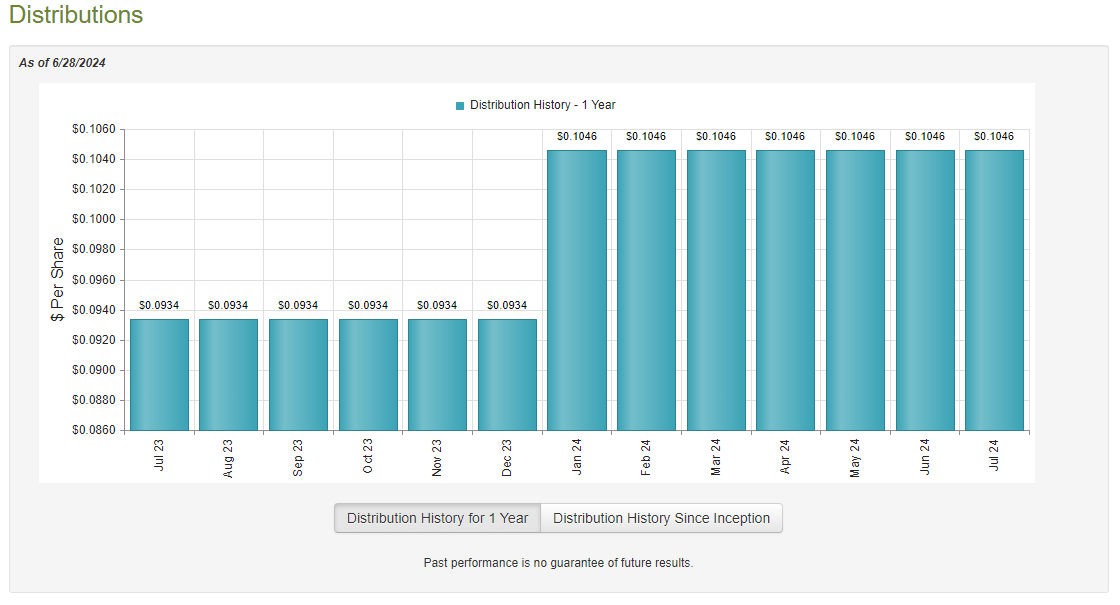
It appears to be fully covering this larger distribution. This chart shows the fund’s net asset value since December 29, 2023 (the closing date of the previous fiscal year):
Barchart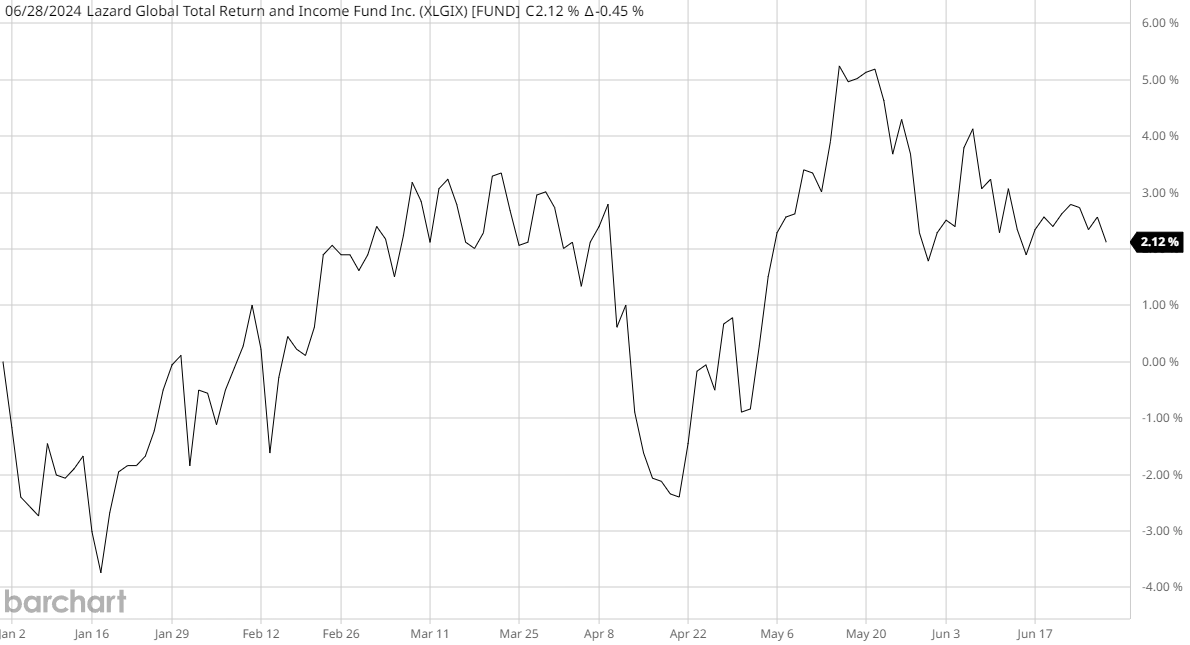
As we can see, the fund’s net asset value increased by 2.12% since the start of this year. This corresponds to the entire first half of the fund’s 2024 fiscal year. The fact that the net asset value has gone up means that it has managed to cover all the distributions fully that it has paid out so far in 2024 and had some excess returns left over. Overall, this is a good situation, and assuming that we do not have a market crash in the second half of this year, the fund will probably be fine to maintain its distribution at the higher level.
Valuation
Shares of the Lazard Global Total Return and Income Fund are currently trading at a 9.41% discount to net asset value. This is substantially higher than the 10.85% discount that the shares have had on average over the past month, but it is still not a bad price.
Conclusion
In conclusion, the Lazard Global Total Return & Income Fund continues to look like a worthy choice for those investors who are seeking to reduce their exposure to the United States and the U.S. dollar. However, its American exposure is higher than that of some of its peers, so that should be considered before purchasing its shares. In addition, the fund has a lower yield and higher leverage than most of its peers. This all might suggest that investors for whom maximizing income or reducing their U.S. exposure is a priority might wish to look at the fund’s peers. This fund does have a very nice discount though, and overall, it is a worthy global fund.
Editor’s Note: This article discusses one or more securities that do not trade on a major U.S. exchange. Please be aware of the risks associated with these stocks.