MarsYu
By Mike Larson
My goal is to help you calmly and rationally assess risks and opportunities here, and make the best moves for your portfolio in the longer term. In my quarter-century-plus of analyzing, writing, and speaking about markets, I’ve learned one thing above all else: Nobody ever made a dime by panicking.
While things are extremely fluid, as of this writing…
1. The Nikkei 225 Index (NKY:IND) in Japan plunged 12.4% overnight. That was the biggest one-day drop since the Black Monday stock market crash in October 1987. Other Asian markets were hit hard, and the selling spilled over into Europe and US markets.
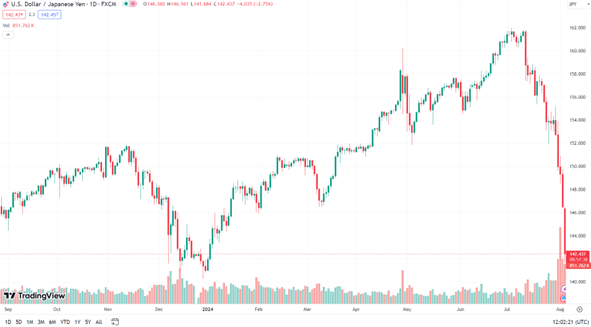
Unwinding of yen carry trades is a big driver here. The Bank of Japan bucked the global trend of central bank easing and raised rates by 25 basis points last week. That added momentum to a mammoth reversal already underway in the Japanese yen. It has now risen from just over 160 against the US dollar to around 142 this morning.
See the USD/JPY chart below (a drop indicates yen strengthening vs. the US dollar). You can also read this primer I wrote back in April about the carry trade for a longer description of the phenomenon and why and how it can impact markets.
USD/JPY Chart (1-Year)
Source: TradingView

2. The CBOE Volatility Index (VIX) jumped above 60 in early US trading. That is up 165% from Friday to the highest level since the Covid-19-related surge in 2020, when it topped 80.
3. US stock indices are down anywhere from 2% to 4%-plus, with the Nasdaq Composite faring worse than the Dow Industrials and the S&P 500 in-between. “Mag 7” names are performing much worse than other stocks, with popular stocks like Nvidia Corp. (NVDA) down as much as 13% in early trading, and Amazon.com Inc. (AMZN) off as much as 7%.
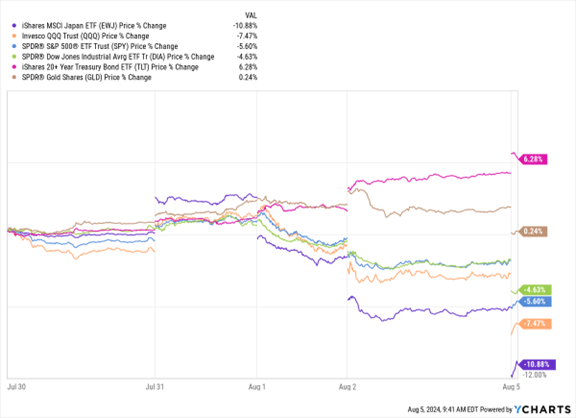
Apple Inc. (AAPL) fell as much as 11% due to the broad selloff and news that Warren Buffett’s Berkshire Hathaway Inc. (BRK.A, BRK.B) slashed its AAPL stake by 50% in the most recent quarter. The chart below shows the percentage change in ETFs that track various asset classes over the past five days, including this morning’s early action.
EWJ, QQQ, SPY, DIA, TLT, GLD (5-Day % Change)
Data by YCharts

4. Gold is getting caught in the liquidation, but outperforming stocks. “Digital gold” is trading much worse. Gold was recently down more than $45 (about 1.9%) to $2,421. But cryptocurrencies are trading like risk assets rather than insurance. Bitcoin plunged as much as 15% to $50,170, showing how “digital gold” is underperforming “real gold.”
5. Treasury yields are tanking. The 2-year Treasury yield was recently down almost 70 bps in five days to 3.74%. Even 6-month Treasury Bill yields were down 11 bps earlier today and about 65-70 bps in two months.
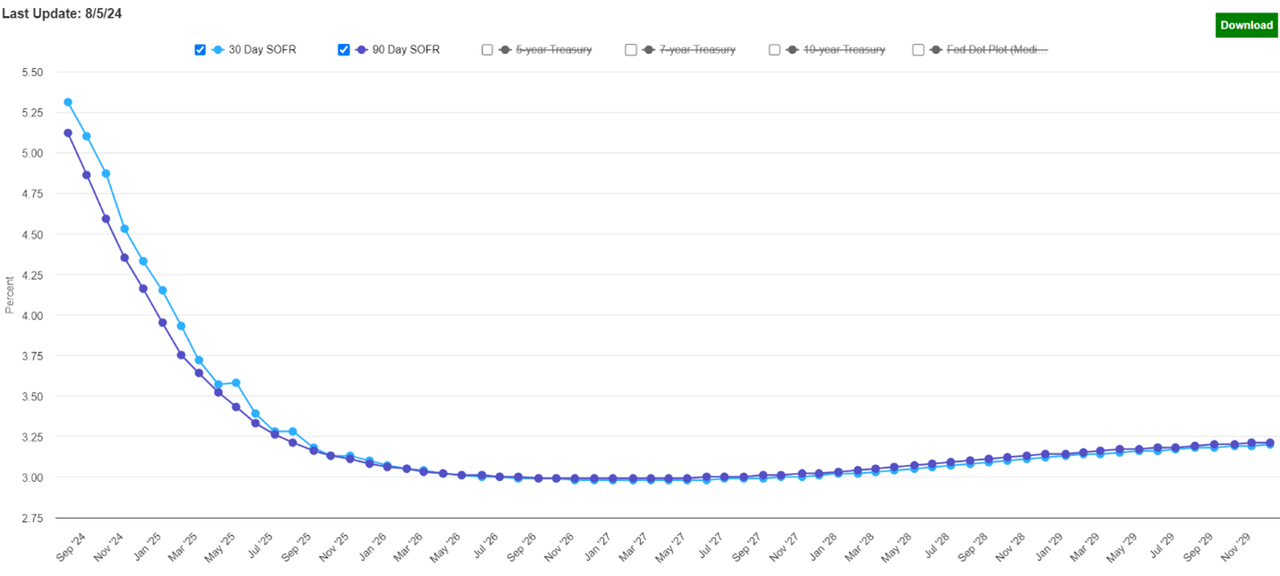
6. This is a market screaming for Fed cuts. The chart below shows the 30-day and 90-day SOFR forward curves. This shows what interest rate markets currently think will happen with overnight rates in the next few years.
Forward SOFR Curve
You can see that very aggressive Fed cuts are being priced in. Markets expect the federal funds rate (which SOFR tracks very closely) to be slashed from the current range of 5.25%-5.50% to around 3%-3.25% this time next year.
What it Means – and What Comes Next
So, what’s behind this action? What does it mean for investors and traders like you? What comes next?
First, this feels and looks to me much more like past “market events” rather than “credit/economic events.” Examples of the former include the Long Term Capital Management crisis in 1998 and the Debt Ceiling Crisis in 2011. Examples of the latter would include the Global Financial Crisis in 2007-2008 and the Dot-Com Bust in 2000-2002.
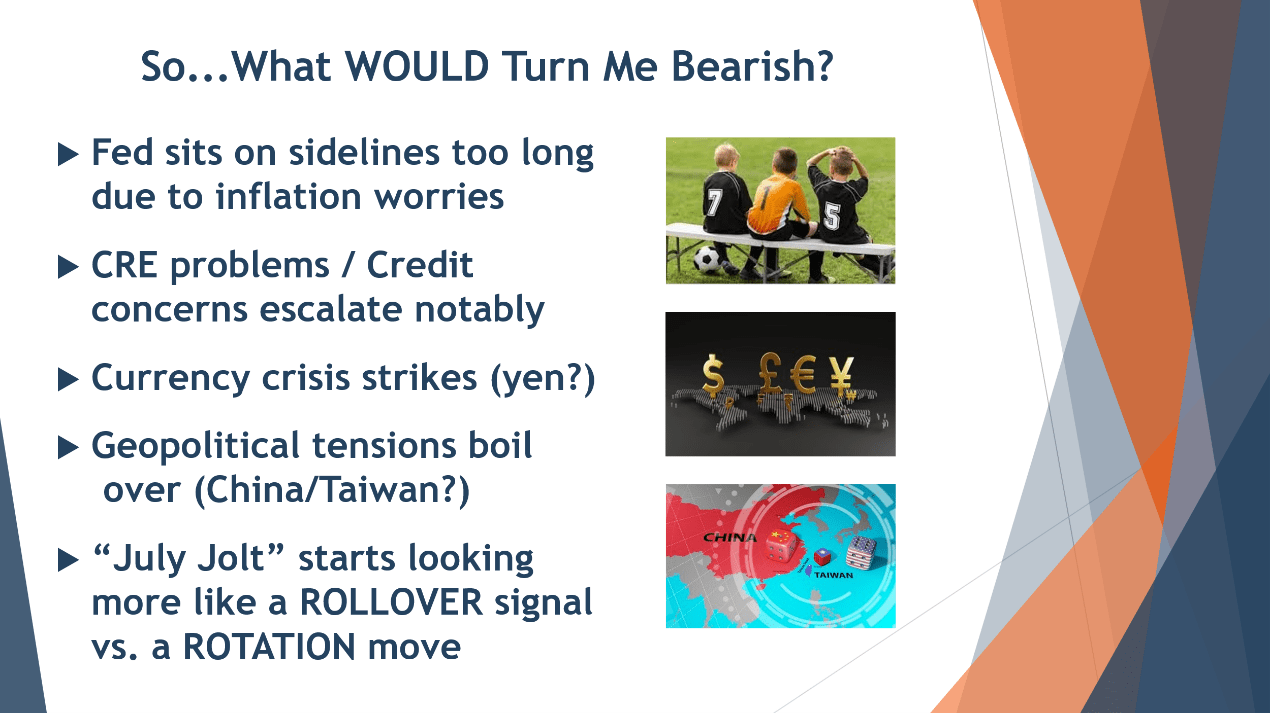
Second, here is the “What would turn me bearish” slide from my presentation at the MoneyShow MoneyMasters Symposium Las Vegas, which just concluded on Saturday. It included a five-item checklist of potential market problems, and I expanded on them during my talk.


We’re ticking off item #3 in a big way today. It’s too early to say whether item #5 is ticked off. That will depend on how market action unfolds in the coming weeks. But I would still maintain this looks rotational, and that a soft landing in the economy is more likely than a hard landing.
Some recent articles that include my perspective on the stock market action can be found here and here. For some thoughts and guidance on gold, see this piece. For some thoughts on Treasuries – and an ETF play that is working out great so far – see this piece.
As for the Fed? I expect the Fed will “fix” item #1 on my checklist before long. Many on Wall Street are saying the Fed screwed up by not starting the rate-cutting process last week, in light of the dismal jobs report last Friday that came out two days after its policy meeting.
Time and time again, we’ve seen the Fed pivot quickly when markets “force” them to. It’s possible we could see an “off calendar/emergency” rate cut of at least 25 basis points as soon as today or tomorrow – whether that’s “right” in the eyes of some analysts and economists or not. I will be watching what happens later this morning once the panic selling at the open is behind us. Then I will be watching closely what happens in the mid-afternoon. If we bottom in the morning, and the rally holds in the afternoon, the worst could be behind us short term. If we roll over into the close, we may get that emergency action overnight/tomorrow morning, and we could bottom then.
Either way, this looks like a buying opportunity longer term once the panic subsides. At the very least, have your shopping list ready. Be opportunistic. Keep a clear head. And keep your long-term investment goals in mind.
Editor’s Note: The summary bullets for this article were chosen by Seeking Alpha editors.
Editor’s Note: This article covers one or more microcap stocks. Please be aware of the risks associated with these stocks.


