tonefotografia/iStock via Getty Images
3Q 2025 – Equities Continue Their Advance
Summary of the Third Quarter
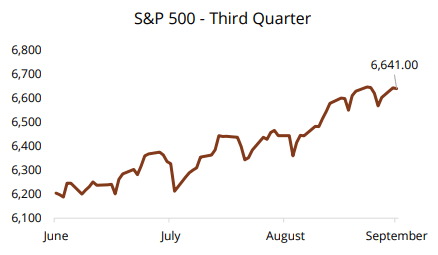
Equity markets continued their rise in the third quarter. The S&P 500 was up 8.1%, bringing the full year return to 14.8%. Further, the market has rallied 34.2% off the April low, marking one of the strongest market rebounds going back to the mid-1960s.
The US economy continues to chug along, inflation has stalled at around 2.8% and unemployment remains low at 4.3%. The main driver of the solid equity returns continues to be the interest in AI and spending to develop the technology.
The Federal Reserve cut rates by 25 basis points in September with the market expecting two more cuts this year. Softness in the labor market was the primary call to lower rates.
Sector Snapshot
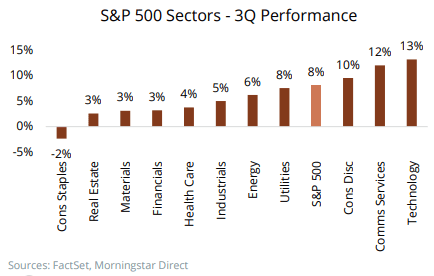
Equity markets were led higher by the Consumer Discretionary, Communication Services and Technology sectors during the quarter. These sectors were also the only sectors to outpace the S&P 500 in the quarter.
Performance dispersion across sectors was quite wide. Consumer Staples, the worst performing sector was down 2%, and trailed the best performing sector, Technology, by 15%.
Not surprisingly with Technology leading performance, Growth outperformed Value during the quarter.
Broadening Out
Broad-based Strength
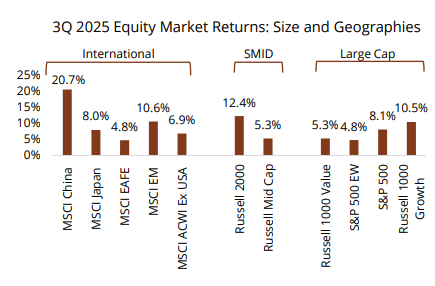
Solid returns were seen across equities, regardless of size and geographies during the third quarter.
Large cap growth and small cap stocks led markets in the US.
International equities also continued to show strength; however, a good portion of the performance can be attributed to weakness in the US dollar.
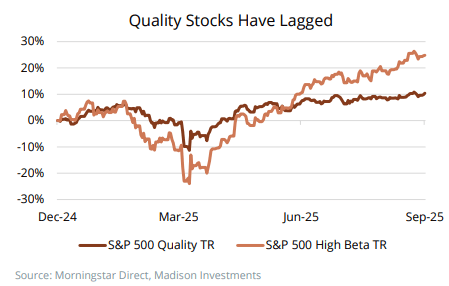
Quality vs Beta
Despite faring better in the “Liberation Day” selloff, high quality stocks have lagged since the April lows as high beta stocks are leading the market higher during this rally.
As the AI driven capex cycle continued to drive headlines and markets higher, similarities to the Technology Bubble of the late 1990s early 2000s have emerged, however, there are also many differences.
Tech Bubble 2.0?
Technical Similarities
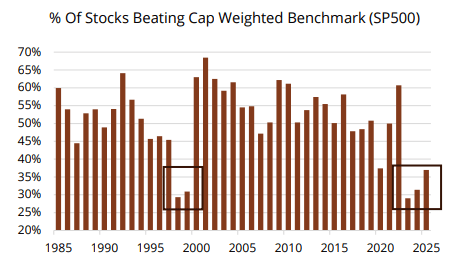
Many are now comparing the AI Rally to the Tech Bubble of the early 2000’s. While there are a handful of similarities, there are also some differences between the past and present.
The continued narrowness of the market today was also seen during the Tech Bubble as the number of stocks underperforming the S&P 500 today is very similar to what was seen in the late 1990s.
In addition, the weight of the Technology sector within the S&P 500 is back to the same level it was then, at roughly 35%.
Fundamental Differences
While some of the technical similarities are concerning, the fundamentals of the Technology sector are stronger today than they were in the late 1990s.
For example, the Technology sector today has stronger operating margins and is more profitable.
This is not to dismiss the demanding valuations that can be seen today, rather, noting that the average stock today is fundamentally stronger than it was at the turn of the millennium.
The Dual Mandate’s Tug of War
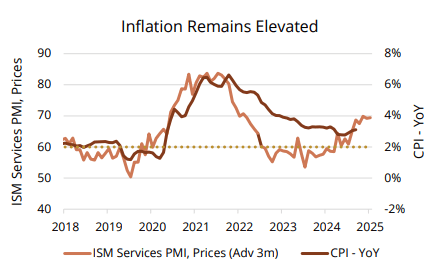
Inflation Remains Elevated
The Federal Reserve (Fed) is caught between supporting a softening labor market while inflation remains above their price stability target of 2%.
Tariff impact on prices to date has been less than the Fed had anticipated, however, the price component of the ISM Services Index suggests that there could be further upside pressure to inflation.
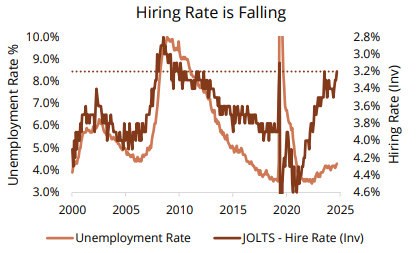
Employment is Softening
In September, the Fed indicated that the uncertainty around inflation is taking a back seat to the growing downside risk to the labor market.
Similar to last year’s data, the Bureau of Labor Statistics annual revision to the nonfarm payrolls number for the year ending in March had the original data overstated by over 900k jobs, indicating to the Fed that the labor market is not as healthy as it was originally thought to be.
Survey data from the Federal Reserve Bank of New York and the Conference Board is also indicating that consumers’ view of the labor market is starting to deteriorate as employers are slowing their hiring plans.
Restarting Interest Rate Cuts
Back to Easing
After a nine-month hiatus, the Federal Reserve cut interest rates at their September meeting by -0.25%, citing growing risks to the labor market.
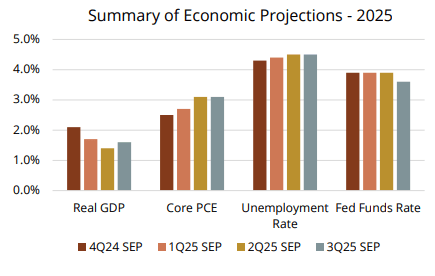
The Fed also indicated in its Summary of Economic Projections (SEP) report that it anticipates cutting interest rates by 0.25% at each of the two remaining meetings in 2025.
As the Fed continues to ease monetary policy in an environment where financial conditions are already easy, the risk to reflating prices is elevated.
Economists Remain Optimistic
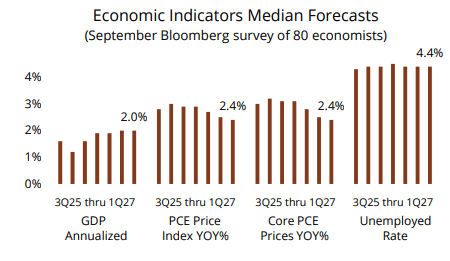
Overall, economists anticipate the combination of monetary and fiscal policy will avert a significant growth slowdown.
Survey respondents assign a 34% chance of a U.S. recession occurring within the next 12 months.
Most forecasters expect inflation will persist near 3% through the middle of next year before dropping towards 2.5% thereafter. Unemployment is predicted to increase from 4.3% to 4.5% during the same period. Within this context, we believe the Fed will continue to lower short-term rates toward 3.5% in the coming quarters.
Tariffs
Tariff Revenue
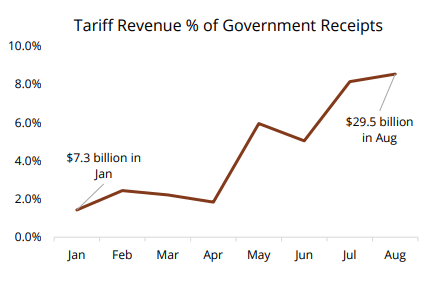
As new tariffs and trade deals continue to be announced, it appears that the administration is targeting an average tariff rate of 15%, considerably higher than the 2% tariff rate at the start of the year.
The legality of the tariffs imposed by the administration has come under scrutiny, with the Supreme Court anticipated to rule on the current tariffs in mid-November.
Should the tariffs be deemed illegal, volatility in both equity and fixed income markets would likely rise as investors question what will happen with the receipts already collected and whether the administration will pursue alternative measures.
Potential Fallout
As the fiscal spending continues, there is a risk that if the newfound revenue source from tariffs is paused, cancelled, or reversed, we could see volatility in the Treasury market as the deficit widens.
These impacts would likely be most pronounced in longer-term Treasury yields as market participants challenge an altered fiscal landscape that would see even wider fiscal deficits.
Should Treasury yields rise materially higher, due to tariffs or otherwise, equity multiples would likely come under pressure from their current elevated levels.
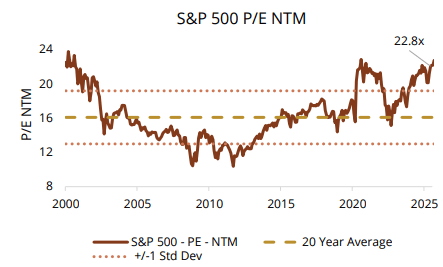
Valuations
(Top Left) The valuation multiple for the market cap weighted S&P 500 continued to grind higher in the third quarter, ending at 22.8x forward twelve-month earnings, placing it in the 98th valuation percentile since 2000.
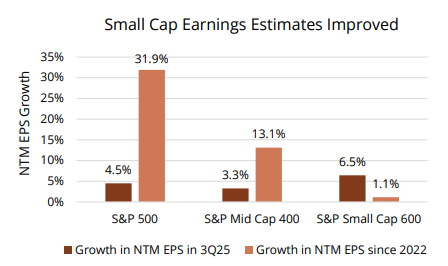
(Bottom Left) Earnings expectations moved higher for all market-cap segments of the US equity markets during the third quarter. The growth in small cap earnings estimates is a notable development as earnings growth in this cohort has lagged both large cap and mid cap since the start of 2022.
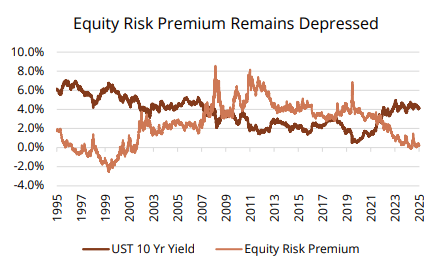
(Bottom Right) With an elevated S&P 500 valuation and with higher long-term interest rates, the equity risk premium continues to be compressed.
Fixed Income Executive Summary
Market Summary (3Q25)
- The Federal Open Market Committee (FOMC) lowered their policy rate (i.e. federal funds) by 0.25% to 4.25%. Chair Powell mentioned labor market concerns currently overshadow potential inflation risks.
- GDP bounced back from a -0.60% first quarter decline by posting a 3.8% gain during the second quarter. On a year-over-year basis, GDP rose 2.0%.
- Headline and core inflation inched up to 2.9% and 3.1%, respectively. Both were 0.2% higher than June due to higher prices within the core services sector. Goods inflation remains below 2%, although tariffs could push goods prices upward.
- Treasury yields declined during the quarter with the 2-year, 5-year, and 10-year maturities edging downward by -0.11% to 3.61%, -0.06% to 3.74%, and -0.08% to 4.15%, respectively.
- During the quarter, A-rated corporate bond spreads tightened 10 basis points (bps) while BBB-rated spreads decreased by 11 bps. The average spread on corporate bonds fell 10 bps to 68 bps.
Matters Madison Fixed Income Are Monitoring
- The U.S. economy continues to expand despite signs of weakening employment. Thus far, the tariffs enforced earlier this year have not impacted consumer prices nor consumption. Vast uncertainties linger as jumbled messages from the incumbent administration and Congressional discord persists unabated. The government shutdown that began on October 1st may have unintended consequences, especially as it relates to the timely release of economic data.
- We anticipate deteriorating employment conditions will cause the Federal Reserve to lower rates by another 0.50% by year-end. We expect the yield curve will steepen further should the Fed cut short-term rates while inflation concerns damper a potential drop in longer rates.
- Risk premiums are creeping towards historical lows, buoyed by resilient corporate creditworthiness and investors purchasing bonds to lock in attractive yields. Caution may be warranted in terms of both sector and issuer selection.
3Q 2025 – Fixed Income Attribution
Attribution Comments
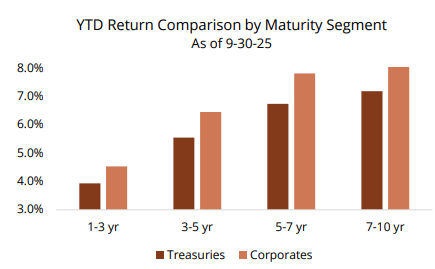
The Bloomberg Intermediate Government/Credit index posted a 1.51% return during the third quarter, extending the year-to-date gain to 5.70%. Return was attributable to coupon income, the downward shift in rates and slightly tighter credit spreads.
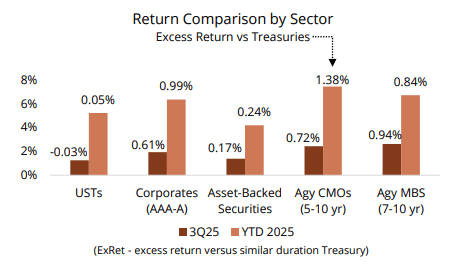
Like last quarter, corporate bonds and agency collateralized mortgage obligations generated more return than comparable maturity Treasuries. The yield advantage benefited both sectors while mortgage-backed prices were also aided by investor demand for what appeared to be a historical cheap sector.
Macro Commentary
Inflation Continues to Hover Near 3%
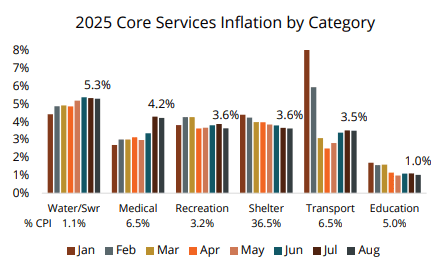
Consumer prices moved higher during the quarter with headline inflation rising to 2.9% and core inflation (excludes food and energy) climbing to 3.1%. The increase in goods prices remained below 2.0% while the price of services rose 3.6%.
The price of Core Services continue to keep inflation elevated as shown in the chart at right. Most categories continue to experience year-over-year price increases of at least 3.5%. Shelter, the largest contributor to services inflation, is trending downward, although the pace of change has slowed.
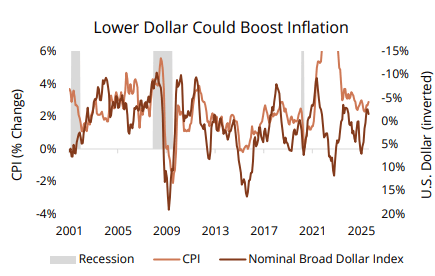
U.S. Dollar Depreciation Poses Inflation Risk
Thus far, U.S. tariff policy has not caused the price of imported goods to soar. Many foreign businesses as well as domestic companies have found ways (e.g. lower margins) to keep prices steady despite the need to pay tariffs.
Regardless if businesses pass along tariff-related costs, a depreciating U.S. dollar (USD) could result in higher consumer prices. This year the USD has depreciated nearly 7% as measured by a trade-weighted dollar index. For consumers this means it takes more USD to buy an equivalent amount of goods which is inflationary.
Asset Class (Governments)
The Fed Lowers Rates for the First Time in 9 Months
In September, the Fed lowered its policy rate (i.e. federal funds) from 4.50% to 4.25%. Chair Powell stated the central bank is more concerned about employment conditions than inflationary pressures which have stabilized this year.
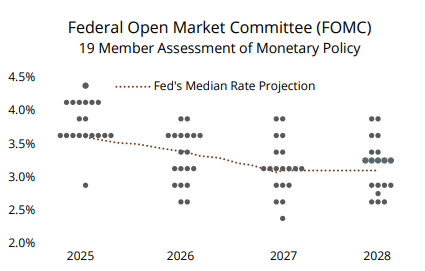
The chart at right illustrates the Fed’s assessment of appropriate monetary policy taking into consideration their outlook for employment, inflation, and growth. The dispersion of estimates is not uncommon and implies the prevalence of economic uncertainty. The median 2025 projection indicates the Fed will likely make two additional 0.25% rates cuts by yearend.
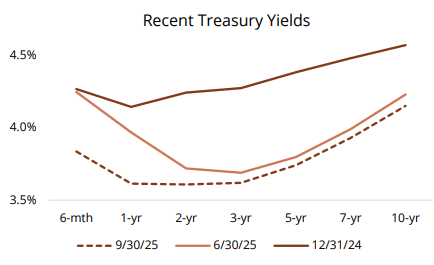
Market Participants Expect a Steeper Yield Curve
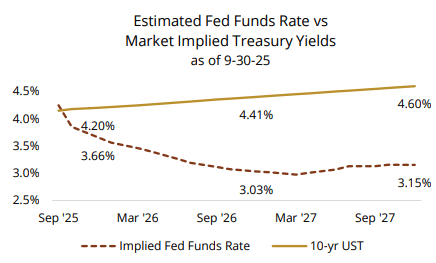
The interest rate curve is likely to steepen as the Fed lowers short-term rates, barring a financial calamity which causes longer rates to plunge. Currently, the gap between 10-year and 2-year Treasury yields is 54 basis points (bps) which is 30 bps below the average spread since 1977.
We foresee the Fed’s policy rate eventually settling near 3.25% to 3.50%. Assuming inflation remains above 2% and the term premium (for investing in longer dated Treasuries) remains positive, we believe the 10-year Treasury yield should linger between 3.75% and 4.25%.
Asset Class (Corporates)
Corporate Creditworthiness Endures
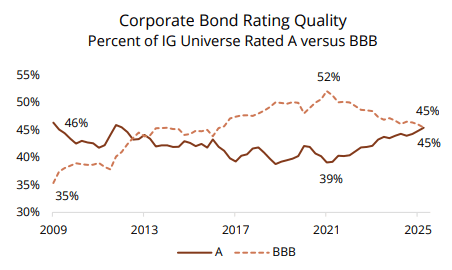
The positive credit cycle continues as evidenced by the trend in agency ratings and risk premiums. Since 2021, investment grade issuers have experienced more upgrades than downgrades, increasing the percentage of A-rated issuers (as measured by market value of outstanding debt).
In recent quarters, banks accounted for over half of the upgrades due to their strong capital structure and favorable regulatory situation. The Insurance and Utility sectors both experienced more downgrades than upgrades as a tough underwriting environment impacted insurers and wildfires/volatile energy prices affected utilities.
Corporate Bond Performance Supported by Yield
Flows into taxable long-term mutual funds and ETFs persisted during the quarter as fixed income investors worked to lock-in yield ahead of Fed rate cuts. This demand supported credit spreads which decreased about 10 bps on average during the quarter. At quarter end, the average spread on intermediate corporate bonds was 70 basis points, according to ICE Indices.
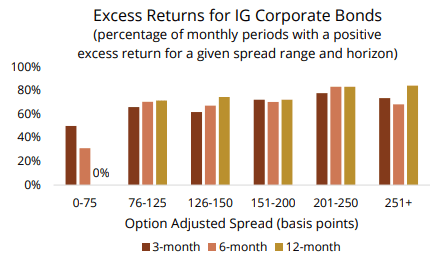
We remain cautious in terms of credit positioning given traditionally low risk premiums. The chart at left shows excess returns for a given spread range at the beginning of a 3-, 6-, or 12-month horizon. Though current spreads indicate a low probability of outperformance relative to Treasuries, we believe there is a benefit of holding corporate bonds to enhance income, an important component of total return.
Asset Class (ABS/MBS & High Yield)
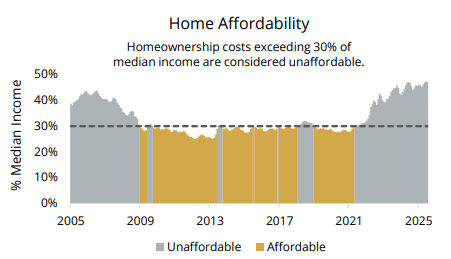
Homes Are Less Affordable and MBS May be Fully Valued
Owning a home has become unaffordable for many households due to higher home prices and mortgage rates. As shown at right, the buying power of many households is constrained by disposable income. Buying a $365,000 starter home with a 10% down payment now requires income of $106,000 to qualify for a mortgage loan. The recent decline in both mortgage rates and home prices may be a catalyst for new purchases and/or refinancing existing mortgages.
Appealing valuations garnered investor interest for mortgage-backed securities (MBS) during the quarter. Some investors alleviated prepayment concerns by positioning well-structured collateralized mortgage obligations. While MBS yields remain attractive, we prefer bonds trading near of below par value.
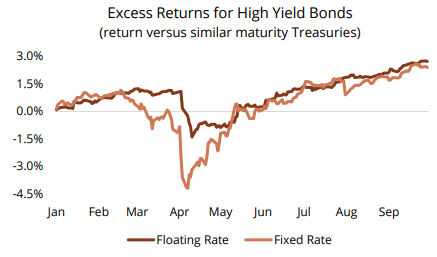
High Yield Positioning – Floating vs Fixed Rate
An interest rate setting that favored floating rate paper since the Fed began tightening monetary policy in 2022 has reversed now that the Fed is easing policy. Year-to-date, fixed rate high yield bonds have generated a 7.21% return versus 5.84% for leveraged loans which have floating coupons.
Leveraged loans are considered less risky than high yield bonds because they often rank higher in an issuer’s capital structure and are less sensitive to rising interest rates. The chart at left displays volatility in terms of excess return.
Although fixed rate total returns have exceeded floating rate returns by 1.38% this year, excess returns on floating rate paper have eclipsed fixed rate paper by 0.32%. A steeper yield curve should favor fixed rate bonds, barring a significant credit event causing spreads to widen.
Asset Class (Sector Valuations)
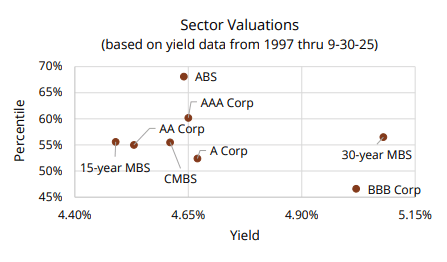
Valuation Comments
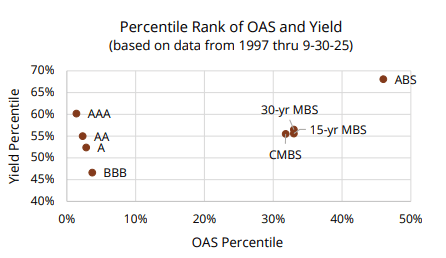
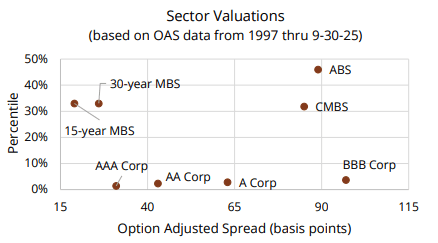
Valuations for all sectors richened this quarter, as measured by percentile rank. As shown at right, structured products continue to offer the best combination of yield and spread, although not as compelling as a few months ago. Corporate bond yields are near the mid-range of past percentile valuations, although option-adjusted spreads are approaching historic lows.
With option-adjusted spreads (OAS) below the 10th percentile, incremental return from corporate spread compression seems unlikely. Mortgage-backed securities appear to offer better value, although we believe prepayment risk necessitates the need to position bonds with prices near or below par value.
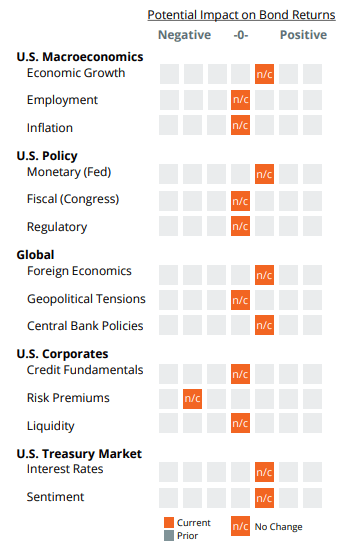
Fixed Income Scorecard
Recession risk has diminished significantly in recent months as GDP continues to expand despite weaker employment. The outlook for growth prospects hinge upon household consumption and business spending as more firms reshore manufacturing. The impact of tariffs along with a weaker U.S. dollar may keep inflation near 3% for an extended period.
Softer employment conditions provide a justifiable reason for the Fed to lower rates in the coming months. This assumes inflation doesn’t spike upward unexpectedly. Congressional disarray may dominate news headlines, although monumental fiscal and/or regulatory change is unlikely in the near term. Federal debt will likely swell should budget deficits grow.
Most global central banks continue to ease monetary policy to fend off a potential growth slowdown. Japan is the notable exception, finding it necessary to raise rates to battle wage and price pressures. So far, global conflicts have not impacted investment markets. Uncertainties surrounding U.S. tariff policies pose ongoing concerns.
To date, U.S. companies appear to be adapting to the enacted global trade policies and changing economic landscape. The creditworthiness of most entities remains resilient, supported by moderate leverage, cashflow generation, and earnings growth. Though risk premiums seem priced for perfection, there is little evidence spreads are apt to gap out substantially.
The yield curve is liable to steepen should the Fed cut rates further. Barring a financial meltdown, it’s unlikely longer term rates will follow the same downward path. Ambiguities surrounding inflation, incremental federal debt, and concerns about U.S. creditworthiness are reasons investors may demand higher yields on government bonds.
Editor’s Note: The summary bullets for this article were chosen by Seeking Alpha editors.