William_Potter/iStock via Getty Images
Investment Thesis
The Vanguard Mega Cap Value Index Fund ETF (NYSEARCA:MGV) provides diversified exposure to U.S. mega-cap stocks for a low 0.07% expense ratio. Led by Berkshire Hathaway (BRK.B), MGV stands out for its excellent quality, a crucial feature no longer shared by most large-cap value ETFs. It’s why MGV will continue to deliver average or better long-term returns, but I will ask readers to consider another low-cost fund that scores slightly better fundamentally. In short, MGV is a solid fund, but there might be better choices than this, and I look forward to taking you through the reasons why in more detail below.
MGV Overview
MGV Strategy Discussion
MGV tracks the CRSP U.S. Mega Cap Value Index, selecting U.S. mega-cap stocks based on five metrics:
- Book to Price Ratio
- Future Earnings to Price Ratio
- Historical Earnings to Price Ratio
- Dividends to Price Ratio
- Sales to Price Ratio
CRSP’s approach acknowledges how market environments can change substantially by incorporating future earnings into the selection process. To illustrate the potential impact, consider how the estimated one-year EPS growth rate for the Energy Select Sector SPDR ETF (XLE) is -4.41% compared to the annualized +41.81% growth over the last three years. Markets are forward-looking, so considering this large discrepancy is essential. At the same time, consensus estimates aren’t always accurate, so splitting the difference seems reasonable.
CRSP Indexes differ from S&P Dow Jones and Russell Indexes because they allow for some overlap. As a result, your portfolio’s efficiency isn’t maximized if you hold several Vanguard ETFs. Below is a matrix summarizing the overlap for Vanguard’s large- and mega-cap offerings, and as you can see, MGV has a 77% overlap with the Vanguard Value ETF (VTV). When deciding between the two, you’ll need to know what that remaining 23% offers, which I plan to highlight later in my fundamental analysis.
MGV Top Ten Holdings
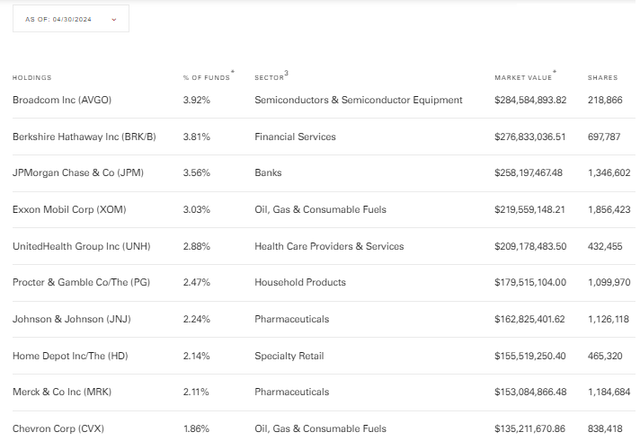
The following table highlights MGV’s top ten holdings as of April 30, 2024, totaling 28.02%. These holdings include Broadcom (AVGO), Berkshire Hathaway, and JPMorgan (JPM), with market caps above $500 billion.
Vanguard will update the holdings list in the middle of this month. However, I accessed Vanguard’s Portfolio Composition File, which updates daily, to determine holdings as of June 3, 2024. Berkshire Hathaway now has a 4.75% weighting, but please note these are subject to change further as the Index completes its five-day quarterly rebalancing process for June.
MGV Performance Analysis
MGV launched on December 17, 2007. However, as disclosed on the Vanguard website, it previously tracked the MSCI USA Large Cap Value Index until April 16, 2013. This Index selects value stocks based on only three metrics (book value to price, 12-month forward earnings to price, and dividend yield), and therefore, MGV’s performance until this date might not be relevant.
Still, MGV’s returns since May 2013 are solid. The following table highlights its 224.53% total return through May 2024, slightly better than the 218.79% return for the VTV. It also had a lower “maximum drawdown” figure and less volatility, leading to superior risk-adjusted returns (Sharpe and Sortino Ratios).
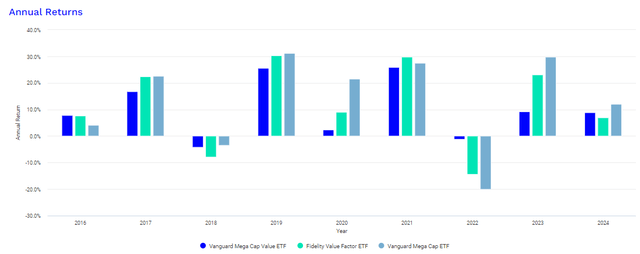
Still, MGV lagged behind the Vanguard Mega Cap ETF (MGC) by an annualized 2.69% (11.21% vs. 13.90%). This difference shows how much better growth stocks performed over this period, but past performance will not necessarily repeat. If we get one or two more years like 2022, when MGV outperformed MGC by 15.86% (-4.10% vs. -19.96%), MGV may be the superior fund over the next decade.
Due to this uncertainty, it is best to compare MGV with other large-cap value ETFs. VTV is one alternative, as is the Fidelity Value Factor ETF (FVAL), another low-cost fund with a different composition you might find more appropriate. As shown below, FVAL has substantially outperformed since October 2016.
MGV Analysis
MGV Fundamentals By Sub-Industry
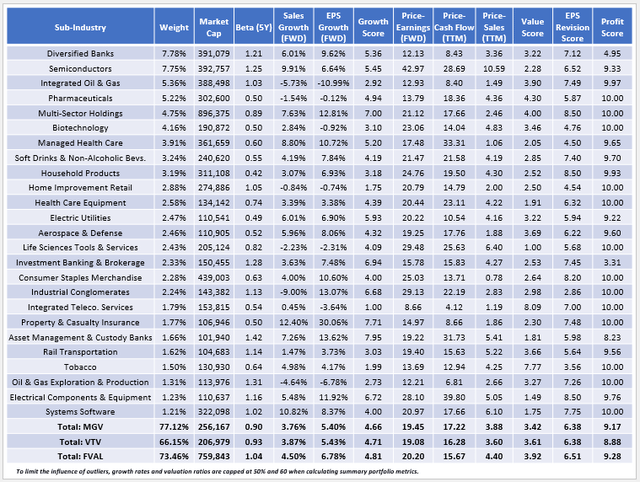
The following table highlights selected fundamental metrics for MGV’s top 25 sub-industries, totaling 77.12% of the portfolio. I’ve also included summary metrics for VTV and FVAL at the bottom, with my observations to follow.
1. MGV is more concentrated than VTV, with 11% more assets allocated to its top 25 sub-industries. However, their fundamentals are similar. For example, MGV and VTV have similar five-year betas (0.90 and 0.93), less than the 0.98 category average and consistent with the downside protection we saw in the earlier performance analysis. MGV and VTV also have similar forward earnings, trailing cash flow, and trailing book ratios (simple weighted average method), and nearly identical estimated sales and earnings per share growth rates. Quality is the only thing separating them, evidenced by MGV’s superior 9.17/10 profit score. All things equal, I recommend the higher quality fund, but the difference is too small to warrant selling VTV.
2. Instead, the comparison between MGV and FVAL is much more interesting. You may have noticed that FVAL’s weighted average market cap is substantially higher than MGV’s, and the reason is that its top two holdings are Microsoft (MSFT) and Apple (AAPL). At first glance, it doesn’t seem like a good value ETF, but FVAL’s 4.40/10 sector-adjusted value score, which I derived from Seeking Alpha Factor Grades, is superior.
Put differently, FVAL is designed for investors satisfied with the broader market’s sector exposures but wanting to overweight the best-value stocks within each sector. The approach is more aggressive than MGV’s but could be a reasonable compromise if you’re still bullish on the Technology sector, which comprises 28% of FVAL compared to 12% in MGV.
3. FVAL also has a higher growth score than MGV (4.81/10 vs. 4.66/10), which includes better estimated sales and earnings per share growth rates. Quality remains high, evidenced by its 9.28/10 profit score, meaning the main thing you’re giving up is downside protection. Most years, FVAL’s returns were between MGV’s and MGC’s, another indication that it’s a solid “compromise” ETF for more aggressive value investors.
Investment Recommendation
MGV is a reasonably well-diversified mega-cap value fund with a low 0.07% expense ratio and exceptional quality. Its strength is downside protection, evidenced by its 0.90 five-year beta and nearly 20% outperformance against the Vanguard Mega Cap ETF in 2022. However, without a strong rotation to value, investors may leave too much on the table. FVAL is one sector-neutral alternative that scores better on growth, value, and quality, and since its 0.15% expense ratio is competitive, I like it slightly more than MGV now. Therefore, I have assigned a solid “hold” rating to MGV, and I look forward to answering any questions you might have in the comments section below. Thank you for reading.


