
JHVEPhoto
In our prior analysis of Micron Technology, Inc. (NASDAQ:MU) from February, we looked into the advancements in the company’s HBM memory technology, highlighting its potential to expand market share through the development of HBM3e. Additionally, we reaffirmed our expectations for Micron’s revenue growth in 2024, anticipating a recovery in market pricing for DRAM (98.9%) and NAND (18.3%), as major players in the memory chip market strive to balance supply and demand.
Since our previous analysis, Micron’s stock has exceeded our price target, surging by 38%. This prompts us to assess whether Micron now warrants a higher valuation in light of recent developments. To begin, we analyzed its revenue growth performance following the release of its Q2 FY2024 results and compared it against our full-year forecast. Furthermore, we analyzed its enhanced profitability in the first half of FY2024, comparing it with our initial margin projections. Lastly, we examined recent government incentives for Micron and evaluated the potential impact on the company’s cash flow.
Revenue Growth Recovery Underway
Firstly, we analyzed Micron’s growth performance to determine whether it has been capitalizing on the memory market recovery and compared it with our previous projections.
|
Micron |
Q1 FY2024 |
Q2 FY2024 |
H1 FY2024 |
Our FY2024 Forecast Growth % |
|
DRAM Unit Shipment Growth |
75% |
56% |
66.1% |
-4.3% |
|
DRAM ASP Growth |
-30% |
-1% |
-16.8% |
82.8% |
|
DRAM Revenue ($ bln) |
3.4 |
4.2 |
7.6 |
19.3 |
|
DRAM Growth % |
21.4% |
55.6% |
38.2% |
75.0% |
|
NAND Unit Shipment Growth |
15% |
4% |
9.9% |
-9.4% |
|
NAND ASP Growth |
-5.4% |
73.3% |
28.3% |
28.7% |
|
NAND Revenue ($ bln) |
1.2 |
1.6 |
2.8 |
4.9 |
|
NAND Growth % |
35.6% |
80.8% |
41.1% |
16.6% |
|
Total Revenue ($ bln) |
4.6 |
5.8 |
10.4 |
24.4 |
|
Growth % |
18% |
62% |
38.9% |
56.9% |
Source: Company Data, Khaveen Investments
Based on the table above, Micron’s revenue growth in H1 FY2024 in total has shown a strong growth of 38.9% with both DRAM and NAND performing strongly. In comparison, our full-year FY2024 forecasts are higher at 56.9%. However, we previously anticipated its growth to increase gradually as pricing recovers. As seen by its quarterly performance, its Q2 growth YoY has increased significantly compared to Q1 FY2024.
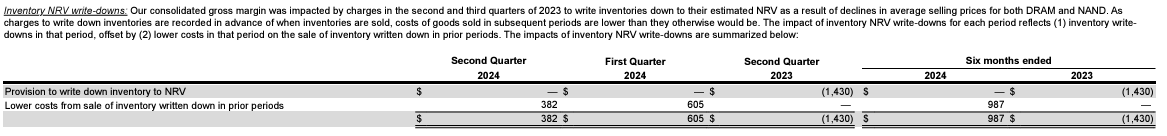
For DRAM, its performance in H1 2023 was mainly driven by unit shipment growth compared to pricing growth. We derived its unit shipments growth of 66.1% YoY, despite its plans to decrease wafer starts, compared to our forecast of -4.3% which we estimated based on its supply growth. We believe this growth could be attributed to the drawdown of its existing inventories. Though, its inventory balance increased to $8.44 bln in Q2 2024 compared to $8.39 bln in 2023. However, we believe this could be attributed to its inventory revaluation, which was written down by $1.43 bln due to lower memory chip prices in H1 2023 and $1.83 bln for the full year in 2023. In H1 2024, as memory chip prices improved, the company revalued its inventory upwards, leading to higher inventory values of $987 mln. We believe this is the amount that resulted in higher sales without the company needing to increase its supply capacity.
Micron
In terms of DRAM pricing, we calculated its actual DRAM pricing growth at -16.8% in H1 2023 compared to our full year of 82.8%. We examined the DRAM market pricing chart below to examine the difference.

JCMIT, PCPartPicker, Khaveen Investments
Based on the chart above, DRAM pricing declined in FY2024, declining by 20% in the period. DRAM pricing only started stabilizing in the beginning period of 2024 based on the chart. However, due to the declines in the prior quarters, by March 2024, DRAM pricing change was still negative YoY at -4.8%. In comparison, our previous projections are for the full year at 82.8%, therefore our pricing forecasts are slightly earlier than the market recovery trend. Notwithstanding, we expect DRAM market pricing recovery to continue throughout the year. Trendforce latest estimates also indicate DRAM ASP rising by 20% QoQ, stronger than its “high teens” growth in the previous quarter.
Furthermore, for NAND, its ASP growth in H1 2023 is in line with our full-year ASP forecast, indicating the price recovery is ongoing as expected. However, unit shipment growth was higher than our full-year forecast of -9.4% despite the reduction in wafer starts, which, we believe, could be attributed to inventory drawdown of existing NAND chips similar to DRAM as explained above.
Moreover, management guided Q2 FY2024 revenue growth to accelerate further to $6.6 bln, which is a YoY growth of 76%. Additionally, analysts’ consensus for FY2024 is in line with our forecast of 58% for this year. Management highlighted in its earnings briefing that “supply-demand balance is tight for DRAM and NAND” which we believe bodes well for continued market pricing recovery. Additionally, management maintained its expectations for capex to be “between $7.5 billion and $8.0 billion”.
Additionally, in terms of HBM for AI servers, management affirmed strong demand for its new HBM3E memory, which has begun commercial production. The company highlighted its recent customer agreement with Nvidia (NVDA) for its HBM to be featured in H200 Tensor Core GPUs which was introduced by Nvidia in 2023 and is expected to be launched in Q2 2024. In our previous analysis of Nvidia, we highlighted the strong demand for its Hopper GPUs which contributed to its surge in Data Center segment growth, with major cloud partners such as AWS (AMZN), Microsoft (MSFT) and Google (GOOG) adopting its GPUs. Furthermore, Micron highlighted the next-gen Blackwell architecture “provides a 33% increase in the HBM3E content”. Management stated that its capacity for FY2024 has been fully booked and it is allocating supply for FY2025, as well as is positive for its market share in HBM to rise to its overall DRAM overall market share, which we had anticipated previously, and we believe its customer agreement with Nvidia further supports its market share growth outlook. In our previous analysis, we had forecasted an increase in market DRAM demand growth due to HBM by 2.2% in 2024 as well as estimate a growth increase of 5.9% due to Micron share gains in HBM to forecast its total DRAM demand growth at 21.8% in 2024.
Outlook
Therefore, we believe our revenue forecast for Micron for FY2024 remains appropriate despite differences between our full-year FY2024 forecasts with its H1 2024 performance due to factors that we attribute to drawdown of existing inventories boosting its unit shipment growth but offset by slower than anticipated recovery in DRAM pricing. We expect the company to continue benefiting from the ongoing market recovery driven by rising pricing as well as robust demand for its HBM memory, which are factors we had already accounted for in our previous analysis. Furthermore, analyst consensus projections are in line with our forecasts (58%). Thus, we maintained our revenue projections for the company, as seen in the table below.
|
Micron Revenue Projection ($ bln) (FY) |
2023 |
2024F |
2025F |
2026F |
|
DRAM |
11.02 |
19.29 |
22.52 |
23.23 |
|
Growth % |
-50.8% |
75.0% |
16.8% |
3.2% |
|
NAND |
4.20 |
4.90 |
4.91 |
4.77 |
|
Growth % |
-46.2% |
16.6% |
0.2% |
-2.8% |
|
Others |
0.36 |
0.20 |
0.20 |
0.20 |
|
Growth % |
-14.9% |
-36.5% |
-43.8% |
0.0% |
|
Total Revenue |
15.54 |
24.39 |
27.63 |
28.20 |
|
Total Growth % |
-49.48% |
56.93% |
13.30% |
2.08% |
Source: Khaveen Investments
Profitability Recovering Faster Than We Anticipated
Furthermore, we examined the company’s profitability as it improved significantly in Q2 FY2024. We compared it with our previous forecasts below.
|
Earnings & Margins ($ mln) |
Q1 FY2024 |
Q2 FY2024 |
H1 FY2024 |
Our Previous Forecast |
|
Revenue |
4,726 |
5,824 |
10,550 |
24,728 |
|
Gross Profit |
-35 |
1,079 |
1,044 |
460 |
|
Earnings Before Interest & Taxes (EBIT) |
-1,128 |
191 |
-937 |
-5,725 |
|
Net Earnings |
-1,234 |
793 |
-441 |
-7,229 |
|
Gross Margin |
-0.7% |
18.5% |
9.9% |
1.9% |
|
EBIT Margin |
-23.9% |
3.3% |
-8.9% |
-23.2% |
|
Net Margin |
-26.1% |
13.6% |
-4.2% |
-29.2% |
Source: Company Data, Khaveen Investments
As seen above, the company’s profitability improved in Q2 FY2024, recovering to positive profitability and supporting its H1 margins which gross margins are positive and higher than our forecasts. While EBIT and net margin were negative in H1 2024, it is higher than our previous forecast in the chart below. Thus, this indicates the company’s profitability improving higher compared to our expectations, which we only expect to reach positive profitability by 2025 as seen below.
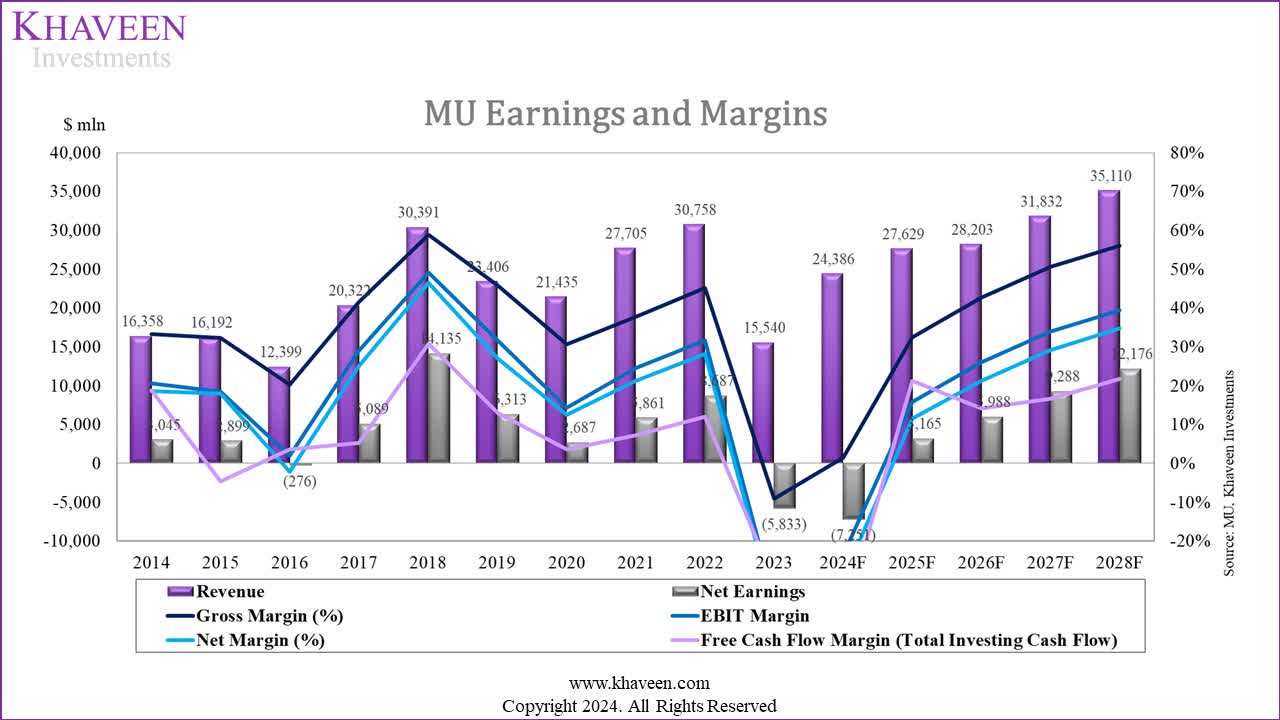
Company Data, Khaveen Investments
|
Our Previous Earnings & Margins |
2023 |
2024F |
2025F |
2026F |
|
Gross Margin |
-9.11% |
1.43% |
32.42% |
42.59% |
|
EBIT Margin |
-35.13% |
-23.59% |
15.80% |
25.96% |
|
Net Margin |
-37.54% |
-29.73% |
11.46% |
21.23% |
Source: Company Data, Khaveen Investments
For 2024, we previously based our forecast assumptions for its COGS on its TTM figures, anticipating a gradual recovery for its margins. According to management, the company “has returned to profitability and delivered positive operating margin a quarter ahead of expectation”. Furthermore, in its quarterly report, its gross margin returned to positive in Q2 2024 mainly due to the increase in NAND ASPs. Furthermore, another factor is due to lower inventory write-downs that impacted its gross margins in FY2023 due to stabilization in DRAM and NAND ASPs. The company had written down inventories in FY2023 as ASPs declined as seen below.

Micron
|
Micron Operating Expenses % of Revenue |
H1 2024 |
Our 2024 Forecast |
|
Selling General & Admin Expenses |
5.1% |
5.76% |
|
R&D Expenses |
15.9% |
19.22% |
|
Other Operating Expense/(Income) |
-2.3% |
0.03% |
|
Operating Income (EBIT) |
-8.9% |
-23.59% |
|
Net Income |
-4.2% |
-29.73% |
Source: Company Data, Khaveen Investments
Furthermore, in terms of the EBIT margin, the higher-than-expected gross margin contributed to the difference between its actual EBIT margin in H1 and our full-year 2024 forecasts. However, there is still a difference of 6.3%. The largest expense of the company is R&D which represented 15.9% of its revenues in H1 2024. However, we previously forecasted it at 19.26% based on its TTM R&D of revenue, a difference of 3.36% to its margins. Besides that, the company’s SG&A % of revenue was 5.1%, slightly lower than our assumption of 5.76% based on TTM as well. Its H1 2024 R&D and SG&A % of revenue are more in line with its long-term 10-year average of 11.81% and 4.17% respectively. Whereas its operating expense was -2.6% % of revenue, compared to our assumption of 0.03% based on TTM as the company received $200 mln in income from its “patent cross-license agreement gain”.
Outlook
Company Data, Khaveen Investments
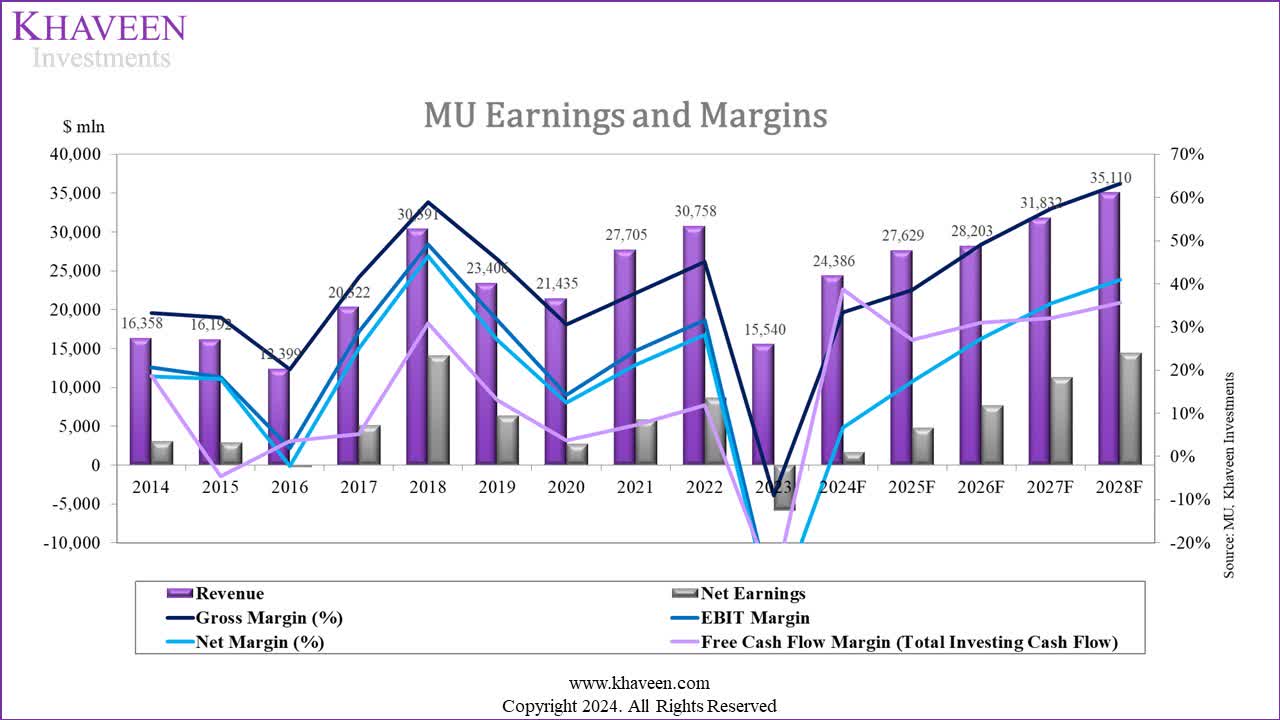
In the past 10 years, its gross margins were positive except in 2023. When its revenues were higher than $20 bln, its average gross margin was 43.3%. As we forecasted the company’s to reach above $24 bln, we expect its gross margins to recover to this level. Thus, we based our forecast for its COGS % of revenue on average of 35.19% in the periods where its revenues were above $20 bln and decreasing gradually over the forward 5 years as its economies of scale improve, resulting in our updated gross margins of 33.3% in FY2024, rising to 63.8% by FY2028. Furthermore, we updated our assumptions for R&D, SG&A and other operating expenses based on its TTM %, forecasting its net margin in 2024 to rise to 6.62% in 2024. Beyond 2024, we based our assumptions for R&D and SG&A on its long-term averages, as well as its Other Operating Expenses as we believe its “patent cross-license agreement gain” is a one-off gain to the company, resulting in our net margins forecast reaching 41.6% by FY2028.
Government Incentives To Benefit Cash Flow Margins
Recently, Micron and the U.S. Department of Commerce recently signed an agreement worth up to $6.14 bln under the CHIPS and Science Act to support Micron’s expansion plans, including a significant investment of approximately $50 bln in cutting-edge R&D and manufacturing facilities in Idaho and New York, projected to be built over the next two decades with a potential total investment reaching $125 bln. Moreover, in addition to the direct funding, the CHIPS Program Office could provide up to $7.5 bln in loans to Micron.
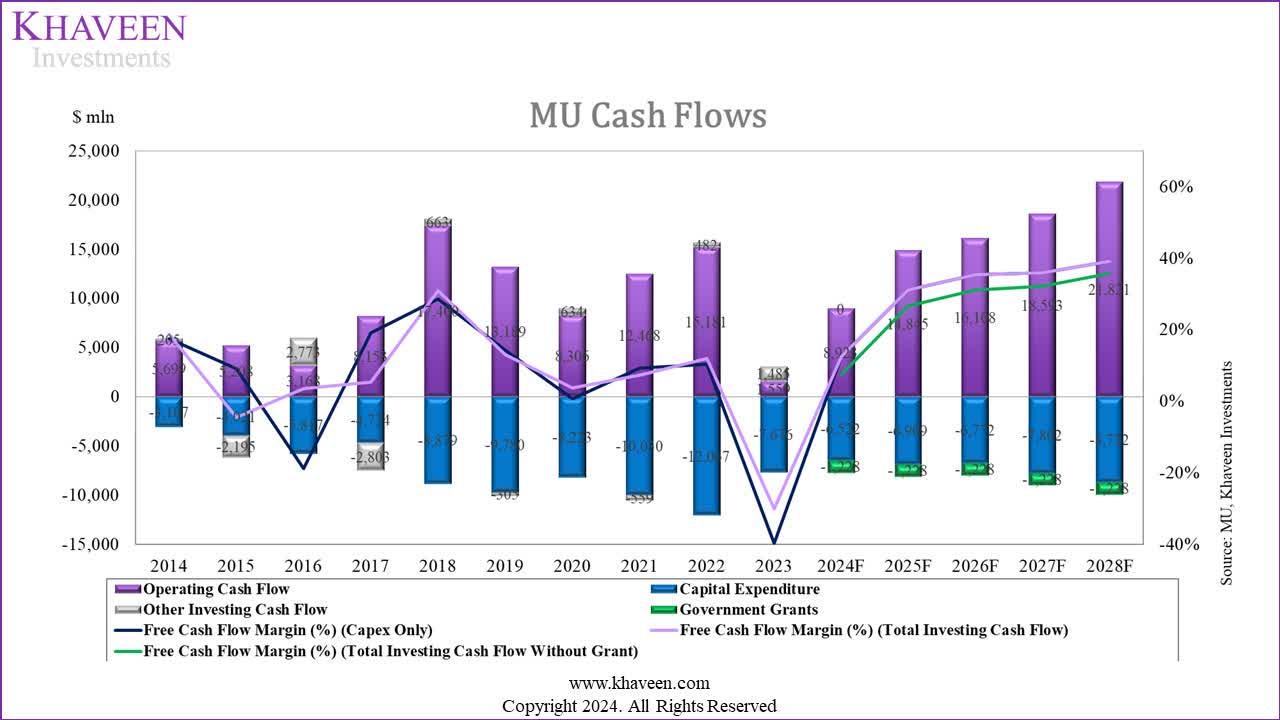
Company Data, Khaveen Investments
|
Micron Cash Flow Projections ($ mln) |
2022 |
2023 |
2024F |
2025F |
2026F |
2027F |
2028F |
|
Operating Cash Flow |
15,181 |
1,559 |
8,923 |
14,935 |
16,112 |
18,593 |
21,835 |
|
Capital Expenditure |
-12,067 |
-7,676 |
-6,522 |
-6,909 |
-6,772 |
-7,802 |
-8,732 |
|
Government Grants |
-1,228 |
-1,228 |
-1,228 |
-1,228 |
-1,228 |
||
|
Free Cash Flow Margin (%) (Total Investing Cash Flow With Grant) |
11.93% |
-30.21% |
12.50% |
31.10% |
35.39% |
35.93% |
39.12% |
|
Free Cash Flow Margin (%) (Total Investing Cash Flow Without Grant) |
7.46% |
26.65% |
31.04% |
32.07% |
35.63% |
Source: Company Data, Khaveen Investments
We accounted for the direct grants of $6.14 bln in our projections of its cash flows. Based on the table above, we included the government grants of $6.1 bln in FY2024, spread out over a period of 5 years, reducing the company’s actual capex requirements to $6.5 bln based on its total guidance of $7.75 bln in capex at the midpoint. As a result, we see its cash flow margin rising to 12.5% in FY2024, a significant improvement compared to negative margins in FY2023. Without the grant, we projected its FCF margin (capex only) at 7.4% in 2024. Beyond 2024, we forecasted its average FCF margin of 30.81% with the grant compared to 26.57% without it, an increase of 4.24%.
Risk: HBM Competition
We believe a risk to Micron is stronger competition from Samsung and SK Hynix in HBM memory which we believe could be a challenge for Micron to increase its market share in the HBM segment, which it lags behind compared to Samsung and SK Hynix as highlighted previously. Both SK Hynix and Samsung (OTCPK:SSNLF) have developed their latest HBM3E products, which could pose competition for Micron’s HBM memory. Notwithstanding, Micron’s management stated that its HBM memory this year is fully sold out and most of its 2025 “supply has already been allocated”, indicating strong demand for Micron’s HBM products.
Verdict
Company Data, Khaveen Investments
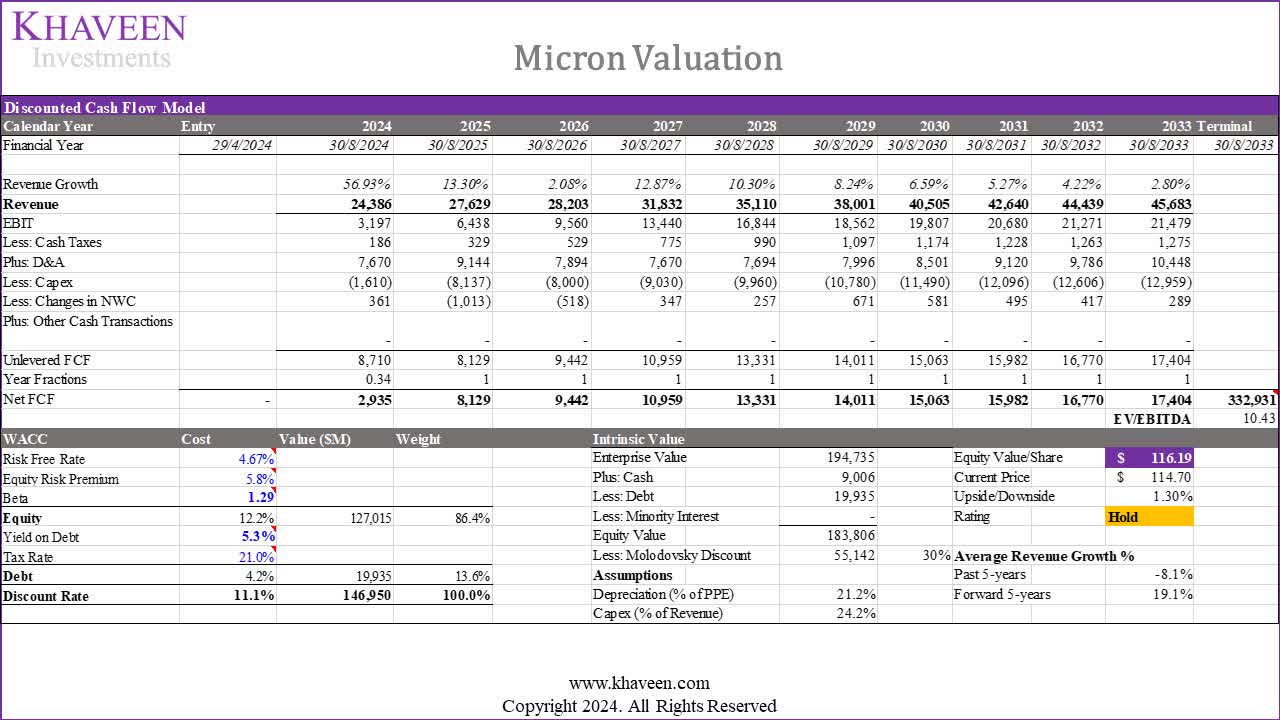
We updated our valuation of Micron, based on a discount rate of 11.1% and terminal valued based on its 5-year average EV/EBITDA, as well as accounting for the Molodovsky discount of 30% which we derived from our previous analysis, we derived an upside of only 1.54% indicating its shares as fairly valued.
All in all, we maintain our optimism regarding Micron’s revenue projections for FY2024, buoyed by the company’s advantageous position amid the ongoing market recovery fueled by rising pricing and robust demand for its HBM memory, factors already accounted for in our previous analysis. Additionally, the company’s profitability has seen a swifter improvement than we initially anticipated, due to ASP improvement and reduced inventory write-downs. Consequently, we have revised our gross margin forecast upward to 33.3% for FY2024, with a projected rise to 63.8% by FY2028, accompanied by net margins of 41.6%. Furthermore, with Micron recently securing a grant from the US CHIPS Act, we anticipate a bolstering of its cash flow margin to 32.64% in FY2024, alongside an increase of 4.24% to its average FCF margins. However, despite these positive developments, our valuation shows its shares are fairly valued with a higher price target of $119.63 compared to our previous analysis ($89.40) as the company’s stock has risen by 38% since our last coverage; thus we maintain our rating of the company as a Hold. It is important to note that we are conservatively applying a 30% Molodovsky discount to account for the cyclicity of the memory market and that without it, the intrinsic value of Micron would be 30% higher than our price target.