SolStock
Author’s Preamble
I have an actively managed investment portfolio, and I regularly trade stocks within my investing universe (or watch list) depending upon the stock’s price relative to my estimate of its intrinsic value and its market trading patterns (technical indicators).
I share my valuations with readers to get feedback and to gain new insights from other knowledgeable investors.
This is the first time that I have valued and written about Monster Beverage Corporation. Let’s dig in.
Company Description
Monster Beverage Corporation (NASDAQ:MNST) is predominantly a developer and marketer of energy drinks and more recently has expanded by acquisition into the craft beer, hard seltzer and flavored malt beverage markets.
The energy drinks market is part of the “alternative” beverage category which includes non-carbonated, ready to drink iced teas, lemonades, juice cocktails, single-serve juices and fruit beverages, ready to drink dairy and coffee drinks, energy drinks, sports drinks and single serve still waters with new age beverages, including sodas that are considered natural, sparkling juices and flavored sparkling beverages.
The company reports 4 market-based divisions. The most recent financial report from MNST is their 2nd quarter FY2024 10-Q filing.
The trailing 12-month (TTM) revenues and operating margins for each division are shown in the following table:


Author’s compilation using data from Monster Beverages 10-K & 10-Q filings.
Monster Energy Drinks is the company’s cornerstone division. Strategic Brands is an off shoot of the energy drinks business (it comprises the energy business acquired from The Coca Cola Company in FY2015) and the Alcohol Brands division is a relatively new business acquired in FY2022.
Monster’s History and Acquisitions
The company was transformed following a transaction with The Coca Cola Company (TCCC) in FY2015. In this important transaction, TCCC swapped its energy drink brands to Monster (which became the Strategic Brands division) and Monster swapped its non-energy brands to TCCC. MNST also issued 102 million new shares to TCCC representing almost 17% of the total trading stock and received $2,150 million in cash. TCCC remains a major shareholder with almost 20% of the current total voting stock.
MNST has made 3 further acquisitions since the TCCC transaction:
- American Fruits & Flavors (AFF) who supplied MNST with most of the flavors for their energy drinks was acquired for $689 M. The AFF supplied ingredients are the most important input into the energy drinks production process.
- CANarchy Craft Brewery was acquired for $330 M. This transaction created MNST’s Alcohol Brands division and marked its entry into the alcoholic beverage sector.
- Vital Pharmaceuticals (known as Bang Energy) was acquired for $364 M. This transaction resulted in the purchase of a small (but fast-growing) competitor but more importantly it gave MNST its first manufacturing facility for energy drinks.
Global Energy Drinks Market
An energy drink is defined by Wikipedia as a “type of functional beverage containing stimulant compounds, usually caffeine, which is marketed as providing mental and physical stimulation”. The beverage can be either carbonated or non-carbonated, it may contain sugar or other sweeteners, and numerous other ingredients such as herbal extracts.
According to a Celsius Holdings (CELH) presentation earlier this year, the global energy drinks market at the end of FY2023 had annual revenues of $44 billion and the market had been growing at 9% per year since FY2018.
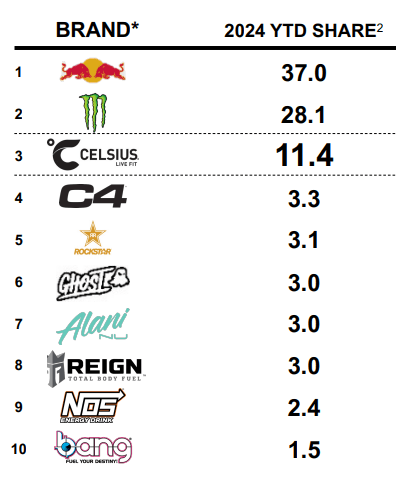
The energy drinks market is dominated by 3 companies but with a long tail of small players. The North American market is the largest in the world. The following table shows the company market shares in percentage terms:

Celsius Holdings Investor Presentation, August 2024
Red Bull, Monster and Celsius have a combined market share of 88%.
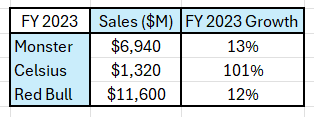
Their reported FY2023 revenues are shown in the following table:

Author’s compilation using data from company SEC filings & from the Red Bull website.
It should be noted that Red Bull is not a public company and reports a limited amount of annual financial information on its website.
The energy drinks market is a sub-category within the broader non-alcoholic beverages sector, which is dominated by Coca-Cola (KO) and PepsiCo (PEP). I estimate that the sector’s global revenues for FY2023 were $282 billion.
The non-alcoholic beverage sector is mature. During MNST’s Q1 earnings announcement, Hilton Schlosberg (vice chairman and co-CEO of MNST) stated that “in the United States, energy is the only segment of the beverage category currently showing unit growth”.
The energy drinks market is also showing signs of approaching maturity, with revenue growth starting to slow, and sector consolidation has started to occur (as evidenced by MNST’s acquisition of the Bang brand).
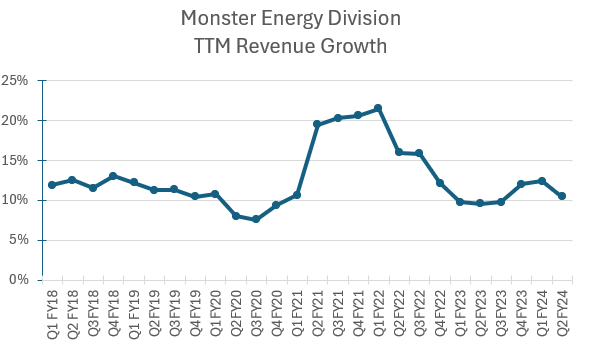
The following chart shows MNST’s TTM revenue growth rate on a quarterly basis:

Author’s compilation using data from Monster Beverage’s 10-K & 10-Q filings.
Prior to the COVID pandemic, MNST’s revenue growth was reasonably steady at around 11% to 13% per year. Growth declined during FY2020 due to the global COVID restrictions. When restrictions were lifted, there was a growth spike due to the easy comparisons with prior periods.
Now that the COVID comparisons have been washed out of the data, we can see that growth has returned to the pre-COVID levels (10% to 12%).
There is considerable evidence that the sector’s growth rate has peaked, but it may take another 5 to 10 years before the sector reaches maturity. The consensus estimates for annual sector growth over the next 5 years is between 5% to 7% (Cognitive Market Research).
Monster’s Historical Financial Performance
Revenues and Operating Margins
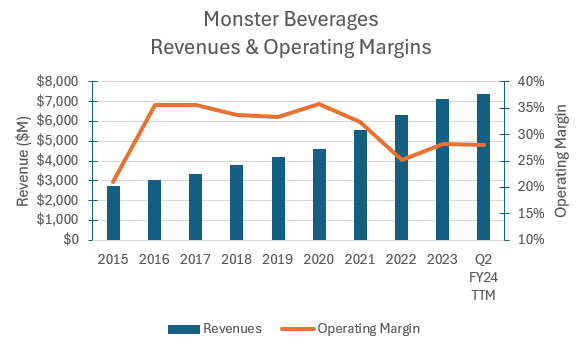
MNST’s consolidated historical revenues and reported operating margins are shown in the chart below:

Author’s compilation using data from Monster Beverage’s 10-K & 10-Q filings.
Over the last 5 years, revenues have grown on average by 13% per year. There has been a tapering in growth over the last couple of years with the emergence of Celsius and the slow maturing of the sector.
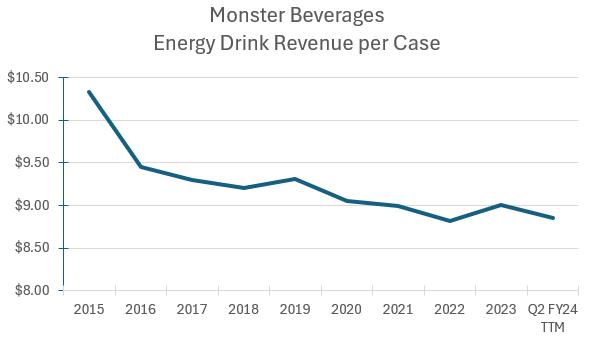
Operating margins post-COVID have declined but now appear to be stabilizing. Lower prices (as measured by revenue per case) appears to be making a significant contribution to the declining margins as shown by the following chart:

Author’s compilation using data from Monster Beverage’s 10-K & 10-Q filings.
Management have stated that they have initiated actions to raise prices, but at this stage these actions are not reflected in the trend data.
It should be noted that typical operating margins in the non-alcohol beverage sector are 13.5% whilst MNST’s margins are currently in the highest decile (as are its main competitors). The main driver for the high margins is the high revenue per case that consumers are currently prepared to pay for energy drinks (shelf prices per fluid oz can be up to 4 times higher than soda).
I would suggest that high prices and high margins may not be a sustainable product mix in the long term as the segment approaches maturity.
Cash Flows
The following table summarizes MNST’s cash flows for the last 10 years:


Author’s compilation using data from Monster Beverage’s 10-K filings.
The table paints a very positive historical picture but also highlights the changes to strategy which are taking place.
The key item is the level of reinvestment. Until recently, this business required very little to be spent to sustain it. This is not surprising as MNST has outsourced the production of energy drinks to 3rd parties.
The recent acquisitions signal that MNST is potentially concerned about a slowing revenue growth trajectory and is attempting to prolong its growth by buying a competitor and by branching out into a new market (alcohol).
Over the last 10 years, MNST has generated $8,194 M of free cash flow after reinvestment. This has been supplemented by contributions received from TCCC’s equity purchase and from MNST’s executives making contributions to the conversion of their options. In total, $10,016 M was available for distribution to shareholders.
Until FY2023, MNST had paid out $7,519 M to buyback stock and banked the remaining $2,500 M in cash.
By the end of the most recent quarter, MNST has spent $3,235 M in buying back stock during FY2024. This is several orders of magnitude higher than what has been previously purchased in one year. Interestingly, debt was used for the first time to partially fund the buyback.
This is another strategic signal to the market that the company’s situation is changing.
I suspect that the level of buybacks is now peaking and that in the future the quantum will be lower as free cash flow growth starts to decline. The next step in MNST’s life cycle will be to initiate a dividend (a sure signal of approaching maturity).
Capital Structure
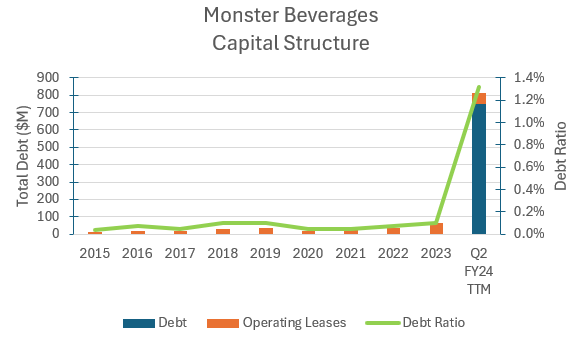
The following chart shows the history of MNST’s capital structure:

Author’s compilation using data from Monster Beverage’s 10-K & 10-Q filings.
MNST’s debt levels had been in-line with similar high-growth companies and the recent addition of debt is generally a signal that the company is beginning to make the transition from high growth to more moderate growth and eventual maturity.
I have no significant concerns about the recent debt issuance undertaken by the company, and the interest payments can be easily sustained from its current cash flows.
Return on Invested Capital
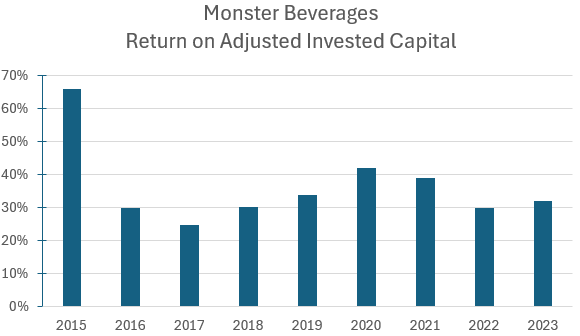
The following chart shows the history of MNST’s return on invested capital (ROIC):

Author’s compilation using data from Monster Beverage’s 10-K filings.
The non-alcoholic beverages sector has a median ROIC of 17%, and I estimate that MNST currently sits in the sector’s highest returning quartile.
MNST’s ROIC is excellent. The drop after FY2015 was caused by the capital injection from TCCC, but since then, it has been reasonably steady for many years.
The high ROIC is driven by its relatively small asset base and its high margins.
The relatively high ROIC leads me to conclude MNST currently has a significant competitive advantage relative to other non-alcoholic beverage companies. I suspect that MNST’s competitive strengths are linked to its brand management and product innovation process.
As the energy sector matures these competitive advantages may come under some stress and I would expect that the ROIC will decline over time.
My Investment Thesis for Monster
Based on Professor Damodaran’s corporate life cycle model, I suspect that MNST is approaching the transition from the mature growth stage to the mature stable stage. This transition period could last for several years.
Growth companies start to experience the symptoms of a mid-life crisis as the market slowly withdraws the growth premium built into its stock price. The declining stock price tends to focus management’s attention on strategies to defend the company’s profitability and to extend its revenue growth trajectory.
We can see evidence of this with MNST. The recent Q2 earnings announcement confirmed that growth in the energy drink market is continuing to decline.
MNST’s revenue growth extension strategies have to date comprised the acquisition of a small competitor (Bang Energy) and the acquisition of CANarchy to gain access to the craft brewing market.
At the same time, MNST is trying to increase its energy drink profitability by raising prices and initiating some in-house production.
Here is my scenario for MNST:
Growth Story
Consumers evidently see energy drinks as an “affordable luxury”. This is reflected in the pricing for the sector, which is significantly higher than for other convenience beverages. Prices have been declining over time and I suspect that this will continue (particularly if the economy slows). Sector analysts are expecting revenue growth at around 6% per year for the next 5 years.
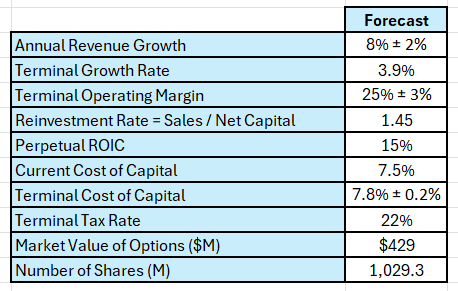
I am projecting that MNST will continue to grow faster than the sector through a combination of innovation, distribution and brand consolidation (acquisitions of smaller brands). MNST should be able to grow revenues by between 6% to 10% each year for the next 5 years.
Although MNST has extended its footprint into the alcohol market in order to maintain its growth trajectory, I am not expecting this division to become a significant contributor to MNST’s future growth and profitability. This market is very competitive and relatively mature.
Margin Story
MNST’s operating margins have been reasonably flat for the last 3 quarters but management has forecast that margins may decline over the coming quarters due to higher commodity input prices.
As the sector’s growth declines over time, I expect that margins will continue to decline due to competitive pressures. I am forecasting that the long-term operating margin will be between 22% to 28% (keeping in mind that typical margins in the non-alcohol beverage sector are currently 14%).
Growth Efficiency
Until FY2023, MNST was essentially a marketing and product development company. It had outsourced its operations to 3rd party bottlers. As a result, MNST had a relatively low capex requirement, but significant amounts of capital were used to develop brand awareness through sponsorships. Following recent acquisitions, MNST now has an operating division which will require capital maintenance.
As the sector approaches maturity, I expect that MNST will continue to acquire smaller brands, and it will continue to invest in its own brand. For this reason, I expect that MNST’s level of reinvestment will remain higher than the sector’s average.
Risk Story
In a slowing economic environment, relatively expensive energy drinks may become a luxury that consumers cannot afford. Due to their appeal to younger demographics, MNST may be able to mitigate some of the economic pressures, but I expect that price will have to be sacrificed in order to maintain volume.
The non-alcohol sector has a relatively low beta, suggesting that it has a lower level of volatility relative to the broader market. Interestingly, the alcohol beverage sector has a higher beta than the broader market.
I suspect that the energy drinks market will become more volatile as economic pressures increase. For this reason, I have allowed MNST’s long-term cost of capital to drift higher over time, up to my estimate of the broader market’s median value (currently 7.8%).
Competitive Advantages
The non-alcohol beverages sector generates high returns on capital relative to the market. MNST’s operating model is particularly strong as demonstrated by its high growth, high margins and high returns on capital.
This would suggest that MNST has a strong competitive advantage. I suspect that this advantage is relatively intangible and linked to its brand development strengths. This type of competitive advantage can be difficult to maintain over time and I suspect that MNST’s returns on capital will slowly decline over time, but they will remain significantly above its cost of capital.
Valuation Assumptions
The following table summarizes the key inputs into the valuation:

Author’s valuation model inputs.
Discounted Cash Flow Valuation
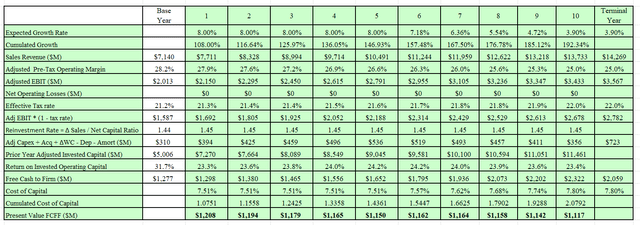
The valuation has been performed in $USD:

Author’s valuation model output.

Author’s valuation model output.
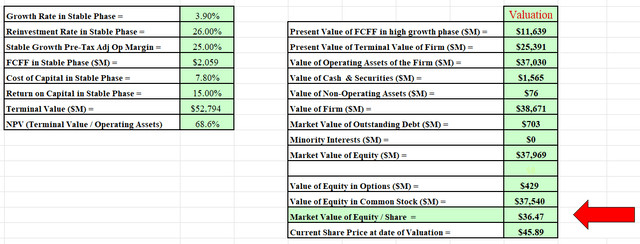
The model estimates MNST’s intrinsic market equity value is around $37 per share.
I also developed a Monte Carlo simulation for the valuation based on the range of inputs for the valuation. The output of the simulation was developed after 100,000 iterations.
The Monte Carlo simulation can be used to help to understand the major sources of sensitivity in the valuation and to also define the valuation’s upper and lower limits:
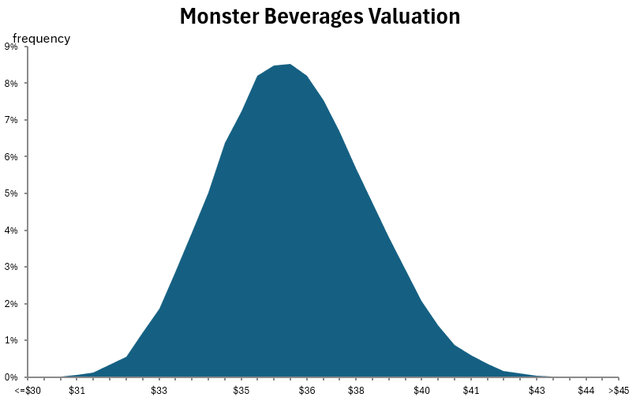

Author’s Monte Carlo simulation output.
The simulation indicates that the valuation is most sensitive to the forecast revenue growth and long-term operating margin.
I estimate that MNST’s intrinsic value is between $30 and $45 per share.
Based on my scenario, MNST is currently expensive relative to its intrinsic value.
Final Recommendation
My report indicates that MSTR has excellent fundamentals, but the future has risks associated with expected growth rates and long-term margins.
What have been the returns to long-term shareholders?
The following table shows the total returns for both MNST, its main listed competitor and the broader market (both market capitalization weighted and equal weighted):


Author’s compilation using data from Yahoo Finance.
Note that I have only shown the performance of CELH for the last 3 years because prior to FY2020 its market capitalization was extremely small, and the stock was not widely traded.
The table indicates that the last year has been very challenging for both energy drink companies. CELH holders were initially rewarded for the company’s market leading growth rates, but market sentiment has turned bearish for both MNST and CELH.
MNST stockholders have been suffering from poor relative performance for more than 5 years.
What have the insiders been doing with their holdings?
Insiders through their individual trading activity often provide useful guidance for independent investors – after all insiders have the best insights into the company’s probable near term financial performance. The following table shows the reported insider trades for the last 2 years:
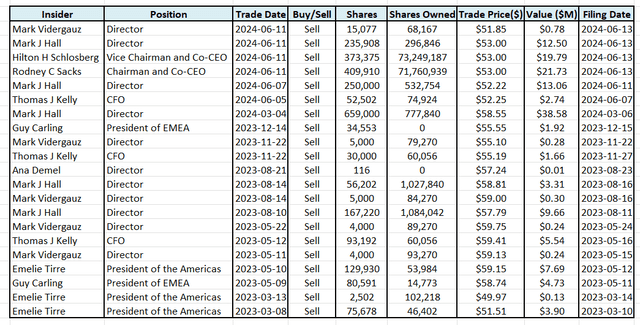

Author’s compilation using data from GuruFocus.
The data indicates that over the last 2 years, insiders have been sellers of stock. Although we don’t know the reasons why individuals have been selling, we do know that they are not buying stock.
In my opinion this is a signal that the insiders believe that the stock may be overpriced.
Are there any valuation clues from the relative valuation metrics?
Many investors rely on relative valuation ratios to provide information regarding whether a stock is cheap or expensive. The following table compares MNST against some of its peers:


Author’s compilation using data from Yahoo Finance.
In my opinion the data indicates that MNST’s relative valuation metrics are perhaps slightly high relative to the market leaders (KO and PEP) in the non-alcohol beverage market, but they appear to be significantly lower than its closest competitor (CELH).
I think that this table supports my view that MNST is currently priced slightly higher than its fair value.
What are the main risks to the MNST valuation and for its current market price?
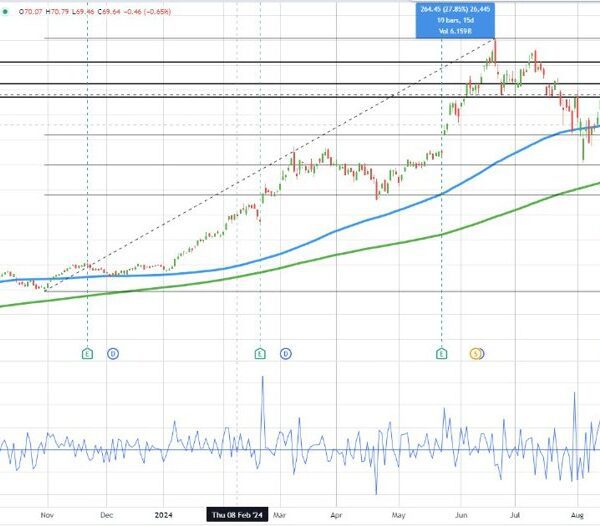
The Monte Carlo simulation identified that the main driver of the valuation is the projected revenue growth rate. This view is certainly shared by the market as can be seen in the following chart which shows MNST’s share price for the last year:
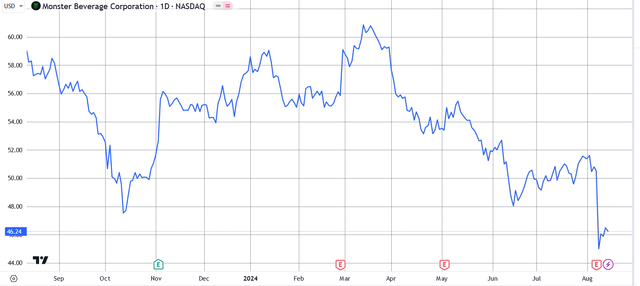

Author’s compilation using TradingView
The chart highlights the step changes in price which appear to take place around the date of each quarterly earnings announcement. The last 3 quarterly earnings announcements were considered by the market to be disappointments, and subsequently the stock has sold off.
What is Monster’s long-term future?
My valuation is based on MSTR operating its business in its current form into perpetuity, however it would not surprise me if MSTR became the subject of corporate action once the company enters the mature phase of its life cycle.
A logical acquirer of a mature MSTR would be its cornerstone investor, KO. There are deep relationships between the 2 companies, and many of MSTR’s routes to market are through KO. It would make sense for KO to patiently wait to see how the energy drink sector’s growth plays out over the coming years, and then buy the MSTR brand portfolio.
KO’s stake in MSTR gives KO control of MSTR’s future.
What should existing shareholders be doing?
Holders of MNST stock have suffered through the under-performance of the last 2 years.
I’m not a technical analyst, but my reading of the MNST chart indicates that there are still no signs that the price has bottomed out. The chart to me indicates that there could still be further price declines to come, either as a result of a general market fall or from deteriorating company performance.
Even though MNST’s price has declined significantly, I still believe that the stock is slightly over-priced relative to its intrinsic value and my call is that MNST is a SELL.
I recommend that on any price rallies that investors trim their holdings in MNST and wait for a lower price to re-enter the trade and participate in any corporate activity which may take place in the future.

