The NASDAQ index has had a impressive rebound from lows. At session lows, the NASDAQ index was down -308.45 points.
The subsequent run back higher took the index to a gain of 202.05. Overall a range of 510 points from low to high.
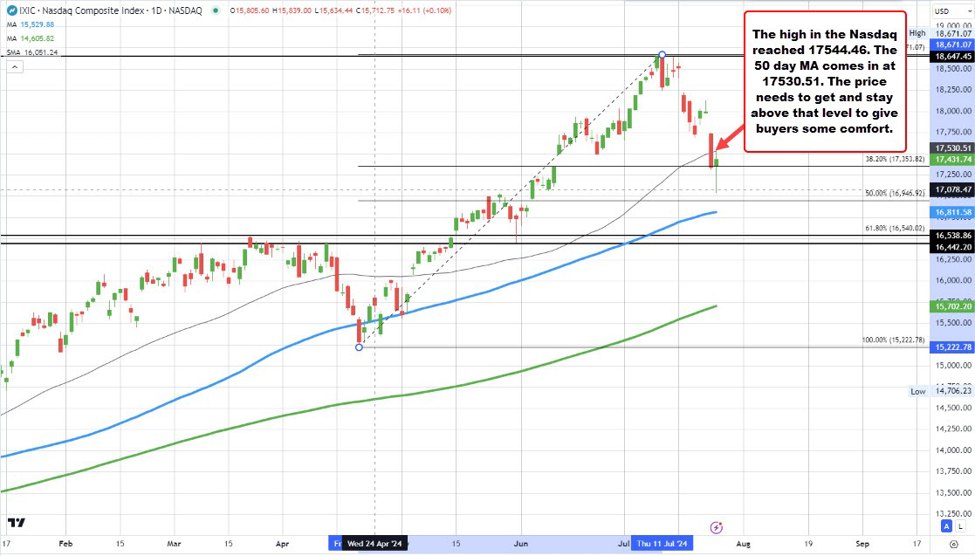
However technically, the high price extended up to test and surpass briefly its 50 day moving average at 17530.57. The high price extended to 17544 before rotating back to the downside. That is a problem for the buyers.
If the buyers are to feel more confident and comfortable, getting and staying above that MA is needed.
The price is currently up 107 points or 0.61% at 17448.30. Can the momentum be restarted? Can the buyers push back above the 50 day moving average?
Looking at the 5-minute chart below, the price has been able to extend back above its 100 bar moving average on that chart at 17403.32 (blue line on the chart below). If the price can stay above that level, there is a technical tilt in the short term which keeps the buyers in play.
Conversely, move below, and we could see buyers turn more to sellers once again.
IN addition to the 50 day moving average at 17530.57 , the 50% midpoint of the move down from Tuesday’s high comes in at 17581.17. That level will also be a level that would need to be broken to show more strength technically.