Fundamental
Overview
This week has been pretty
boring all around as the lack of catalysts kept the price action confined in a
tight range. The market is waiting for the key economic releases next week as
we will get the ISM PMIs and lots of US labour market data including the NFP
report.
As a reminder, the Fed is
now very focused on the labour market as Fed Chair Powell said that they will
not welcome any more weakness and will do everything they can to keep it
strong. Therefore, the data will decide whether the central bank will go with a
standard 25 bps cut in September or take a more aggressive approach with a 50
bps cut.
In today’s context though,
weaker labour market data and the prospect of a 50 bps cut might not be enough
to lift the stock market and could actually lead to more downside on
recessionary fears, so that’s something to keep in mind.
Nasdaq
Technical Analysis – Daily Timeframe
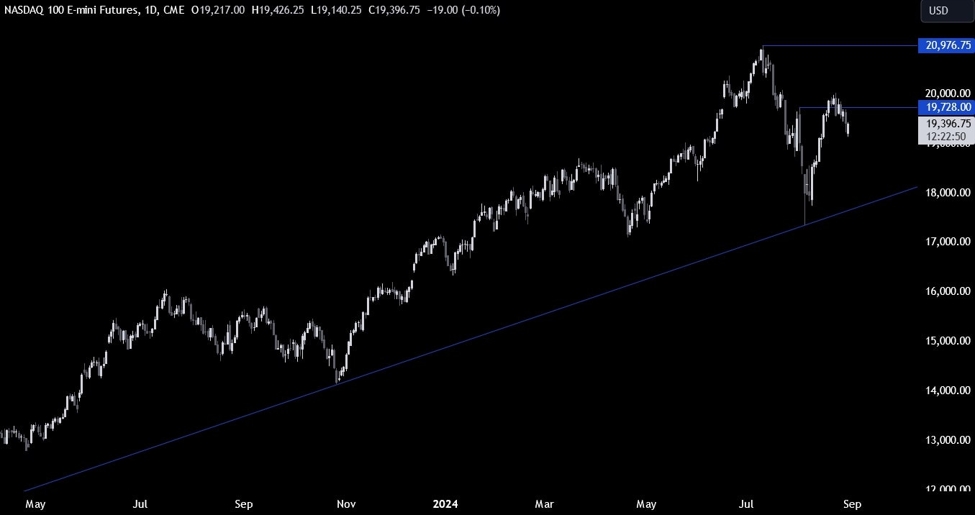
Nasdaq Daily
On the daily chart, we can
see that the Nasdaq recently fell below the key 19728 level and extended the
drop into the 19135 level. Pullbacks are good things, especially after such a
big rally from the lows.
The buyers will now likely
look for entries on the lower timeframes to see whether the bullish momentum returns
or the bearish momentum extends further. The sellers, on the other hand, will
look for pullbacks and breaks to position for more downside.
Nasdaq Technical
Analysis – 4 hour Timeframe
Nasdaq 4 hour
On the 4 hour chart, we can
see that we recently broke below the upward trendline
and extended the drop to the downside as more sellers piled in. We now have a
downward trendline defining the current bearish momentum.
The buyers will want to see
the price breaking higher to pile in and position for a rally into new highs.
The sellers, on the other hand, will likely lean on the trendline with a
defined risk above it to position for new lows.
Nasdaq Technical
Analysis – 1 hour Timeframe
Nasdaq 1 hour
On the 1 hour chart, we can
see more clearly the recent price action with lower lows and lower highs keeping
the downward trend on this timeframe intact. There’s not much else we can glean
from this timeframe as the sellers will look for a rejection on the trendline,
while the buyers will look for a break. The red lines define the average daily range for today.
Upcoming Catalysts
Today we get the latest US Jobless Claims figures, while tomorrow we conclude
the week with the US PCE report.