Fundamental
Overview
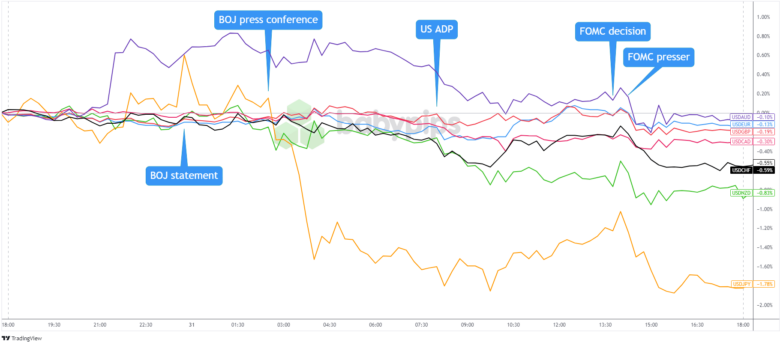
The Nasdaq has been on a steady decline since the last US CPI report on
July 11th. In the first stages of the pullback, we’ve been seeing a
rotation from big cap stocks into small cap stocks as the Russell 2000
displayed an opposite price action. Eventually, the bearish momentum picked up
and we saw a more aggressive decline with the index falling by 10%.
A good argument
has been that most of the moves we’ve been seeing were driven by deleveraging
from strengthening Yen. Basically, the squeeze on the carry trades
impacted all the other markets. Given the magnitude of the recent appreciation
in the Yen and the correlation with many other markets, it looks like this
could have been the reason indeed.
It seems like the
correlation with the Yen has finally faded now that the BoJ decision is in the rear-view mirror. Moreover,
we had the FOMC rate decision yesterday and as expected it was a dovish
one. Fed Chair Powell hinted to a September rate cut and didn’t even close the
door for “several” rate cuts before the end of the year. The market continues
to expect at least two rate cuts by the end of the year and sees some chances
of a back-to-back cut in November.
Overall, this should
continue to support the soft-landing narrative and be positive for the general
risk sentiment as the Fed is going to cut rates into resilient growth.
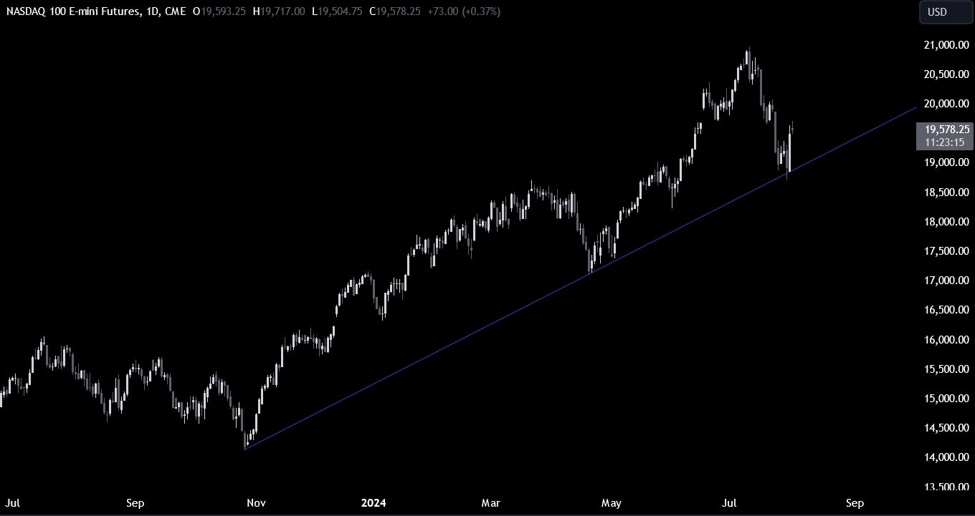
Nasdaq
Technical Analysis – Daily Timeframe
Nasdaq Daily
On the daily chart, we can
see that the Nasdaq eventually bounced on the major trendline around the 18900 level. The buyers
stepped in with a defined risk below the trendline to position for a rally into
a new all-time high. The sellers will need the price to fall back to the
trendline and break below it to start looking for new lows.
Nasdaq Technical
Analysis – 4 hour Timeframe
Nasdaq 4 hour
On the 4 hour chart, we can
see that the price yesterday broke above the key downward trendline and the
resistance zone around the 19350 level. The resistance
now turned support and we have also the 38.2% Fibonacci
retracement level there for confluence.
If we get a pullback from
the current levels, that’s where the buyers will likely step in with a defined
risk below the support
to position for new highs. The sellers, on the other hand, will want to see the
price breaking lower to pile in for a drop back into the major trendline
targeting a break below it.
Nasdaq Technical
Analysis – 1 hour Timeframe
Nasdaq 1 hour
On the 1 hour chart, we can
see that the price is getting rejected from a strong resistance zone around the
19700 level. If the price were to break higher, we can expect the buyers to increase
the bullish bets into new highs.
The sellers, on the other
hand, will likely step in around these levels with a defined risk above the resistance
to position for a drop into the major trendline. The red lines define the average daily range for today.
Upcoming Catalysts
Today we get the latest US Jobless Claims figures and the US ISM
Manufacturing PMI. Tomorrow, we conclude the week with the US NFP report.