Fundamental
Overview
The Nasdaq bounced strongly
from the lows last week following the good US Jobless Claims figures as the data quelled some of
the fears around the labour market after the weak US NFP report.
That’s been also evident
from the market pricing for rate cuts as expectations for a 50 bps cut in September
kept on being pared back with now a 25 bps move seen as more likely.
All of the above
contributed to a more positive risk sentiment in the market with the focus now
on the US CPI report tomorrow where benign figures will likely give the bulls
some more support.
Nasdaq
Technical Analysis – Daily Timeframe
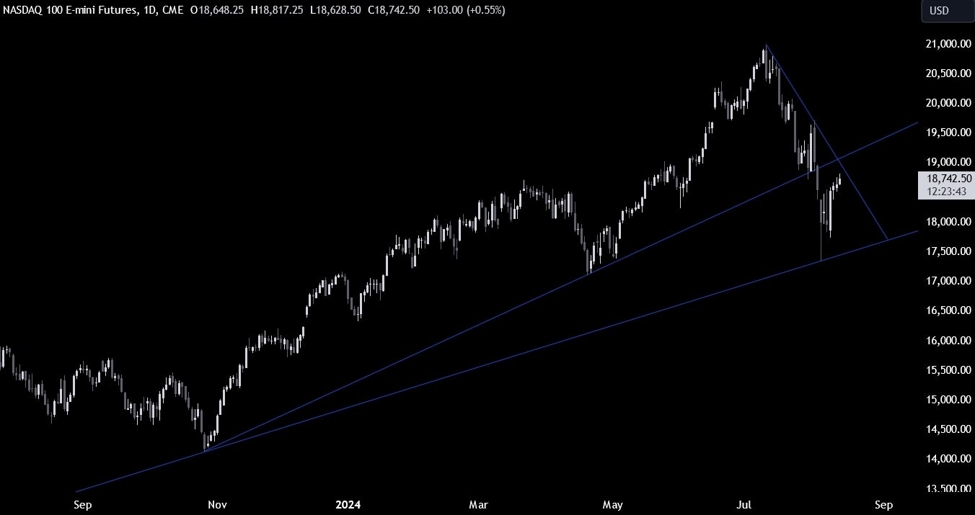
Nasdaq Daily
On the daily chart, we can
see that the Nasdaq is approaching a key downward trendline around the 19000 level. That’s
where we can expect the sellers to step in with a defined risk above the trendline
to position for a drop back into the lows. The buyers, on the other hand, will
want to see the price breaking higher to increase the bullish bets into new
highs.
Nasdaq Technical
Analysis – 4 hour Timeframe
Nasdaq 4 hour
On the 4 hour chart, we can
see that the price recently broke above a strong resistance zone around the 18500 level and increased
the gains as more buyers piled in. We can also see that we now have an upward
minor trendline defining the current bullish momentum.
If we were to get a
pullback into the 18500 zone and the trendline, we can expect the buyers to
step in with a defined risk below the trendline to position for a break above
the major trendline with a better risk to reward setup. The sellers, on the
other hand, will want to see the price breaking below the trendline to increase
the bearish bets into new lows.
Nasdaq Technical
Analysis – 1 hour Timeframe
Nasdaq 1 hour
On the 1 hour chart, we can
see more clearly the recent price action which has been quite tentative as we
head into the US CPI report tomorrow. There’s not much else to glean from this
timeframe as the market participants will wait for a catalyst or the price to
reach the key levels. The red lines define the average daily range for today.
Upcoming Catalysts
Today we get the US PPI data. Tomorrow, we have the US CPI report. On
Thursday, we get the US Retail Sales and Jobless Claims figures. Finally, on
Friday, we conclude the week with the University of Michigan Consumer Sentiment
survey.