Richard Drury
The Virtus Convertible & Income Fund (NYSE:NCV) is a closed-end fund, or CEF, that income-focused investors can purchase as a way of achieving their goals of generating a high level of current income from the assets in their portfolios. The fund does manage to do fairly well at this task, as it has a 12.83% yield at the current price. This is obviously fairly attractive compared to most other things in the market, and it also compares pretty well with peer closed-end funds:
|
Fund Name |
Morningstar Classification |
Current Yield |
|
Virtus Convertible & Income Fund |
Fixed Income-Taxable-Convertibles |
12.83% |
|
Advent Convertible&Income Fund (AVK) |
Fixed Income-Taxable-Convertibles |
11.62% |
|
Calamos Convertible&High Income Fund (CHY) |
Fixed Income-Taxable-Convertibles |
10.87% |
|
Ellsworth Growth and Income Fund (ECF) |
Fixed Income-Taxable-Convertibles |
6.54% |
|
High Income Securities Fund (PCF) |
Fixed Income-Taxable-Convertibles |
11.27% |
|
Bancroft Fund (BCV) |
Fixed Income-Taxable-Convertibles |
8.37% |
As we can clearly see, the Virtus Convertible & Income Fund has a markedly higher yield than most of its peers. This is almost certainly going to attract some investors, especially because the convertible securities contained in this fund do not require investors to sacrifice all the upside potential that investing in fixed-income securities would ordinarily require. However, as I have pointed out before, an outsized yield relative to peers is frequently a sign from the market that the fund may not be able to sustain the distribution that it is currently paying out. Thus, potential investors are advised to use caution.
As regular readers can likely remember, we previously discussed the Virtus Convertible & Income Fund in late January 2024. At the time, I suggested that investors may want to avoid the fund given its history of underperforming similar funds and benchmark indices. This suggestion turned out to be a good one, as shares of the fund are down 1.85% since that article was published. This was a substantial underperformance relative to the S&P 500 Index (SP500) as well as to the iShares Convertible Bond ETF (ICVT):
Seeking Alpha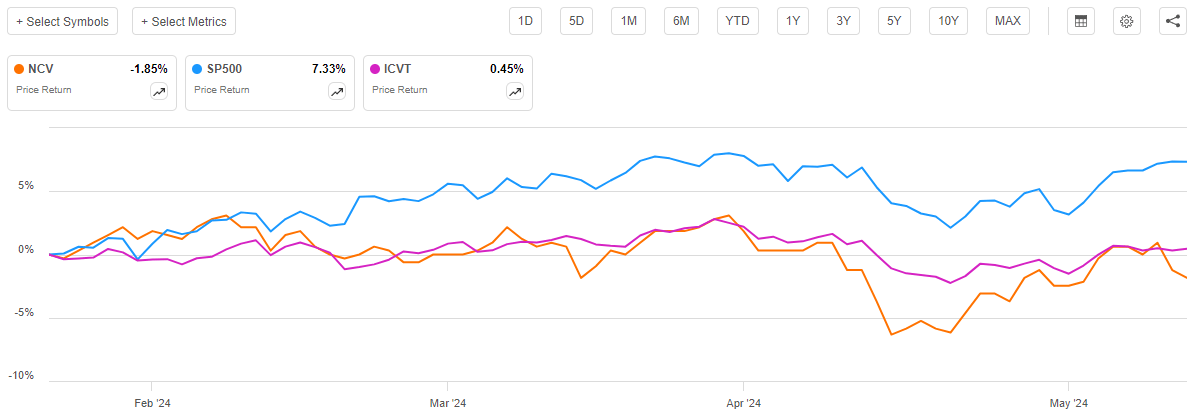
This makes this one of the few closed-end funds to have experienced a decline in its share price over the period. As we have seen in previous articles, even investment-grade and junk bond closed-end funds have generally seen their share prices increase year-to-date even though bond prices are down. The fact that the Virtus Convertible & Income Fund suffered a share price decline is therefore likely to be something of a turn-off to many investors.
However, as I stated in my previous article on this fund:
Investors should consider the impact of a fund’s distributions as part of their analysis of its performance. After all, closed-end funds such as the Virtus Convertible & Income Fund tend to pay out all of their investment profits in the form of distributions rather than relying on the performance of the fund’s own shares to provide investors with an acceptable return. This tends to result in these funds having worse share price performance than index funds, but their investors can actually do better over time because the distributions either boost the share price appreciation or offset share price declines. As such, we should consider the fund’s distributions in our analysis.
When we consider the distributions that were paid out by the Virtus Convertible & Income Fund as well as the bonds held by the convertible bond index fund since late January, we get this chart:
Seeking Alpha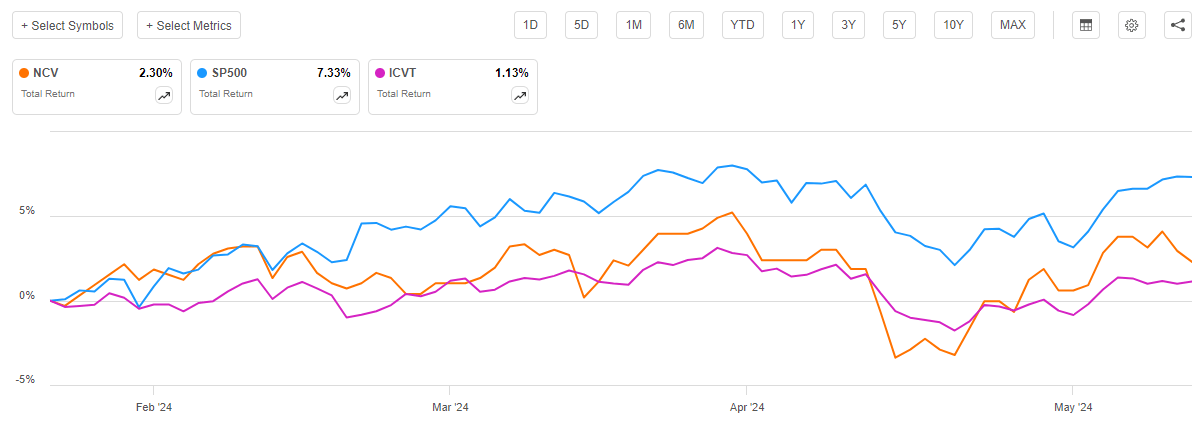
As we can clearly see, shareholders of the Virtus Convertible & Income Fund realized a 2.30% total return from the date that my previous article was published. This is better than the 1.13% total return that the iShares Convertible Bond ETF delivered over the same period, mostly because the index has a considerably lower yield. However, the Virtus Convertible & Income Fund still underperformed the S&P 500 Index by quite a lot. Naturally, though, we would not really expect a bond fund to outperform a common stock index. Convertible bonds do tend to exhibit a certain correlation with common equities, though, so we would normally expect its performance to be closer than we see here. As I pointed out in my previous article on this fund, the Virtus Convertible and Income Fund has a history of underperformance relative to common stocks, though, so we should not be too surprised here.
The Virtus Convertible & Income Fund also has a long history of underperforming its peers by a substantial margin. This chart shows this fund’s total return along with that of each of the peers listed earlier over the past five years:
Seeking Alpha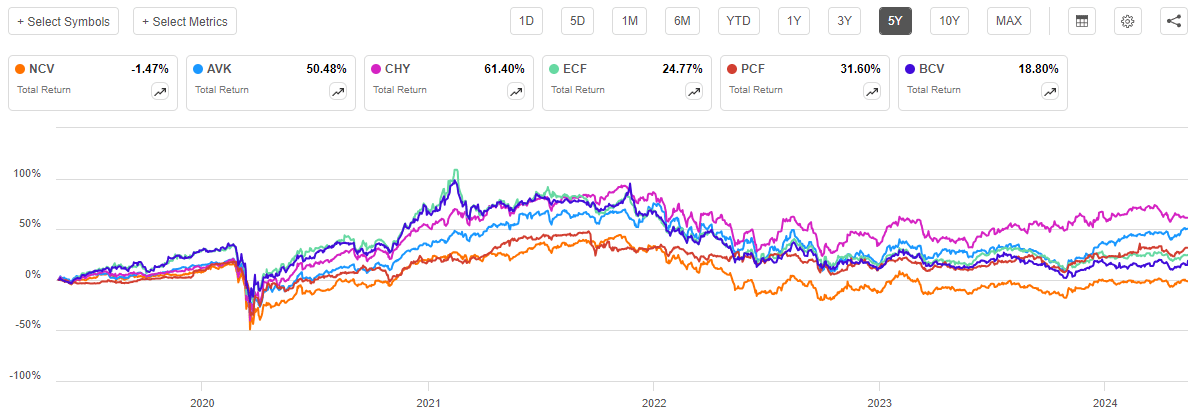
This chart does include the returns provided by the distributions paid out by each of the funds over the period. As we can clearly see, the Virtus Convertible & Income Fund was the only one of these funds to hand its investors a loss over the period. The remainder of the funds all paid out sufficient distributions to more than offset any share price declines that were experienced over the five-year period. In the case of a few of these peers, the performance difference is quite stark, as the Virtus Convertible & Income Fund only managed to achieve a small loss while the Calamos Convertible & High Income Fund increased its shareholders’ wealth by 61.40% over the period.
In short, income investors might be attracted by the fund’s high-yield relative to its peers, but their portfolios would have been in much better shape had they invested in any of the other closed-end funds on the market that employ similar strategies.
However, the past performance of a fund is no guarantee of its future results, and as such we should always take a look at the fund as it stands today. This article will endeavor to do that as we discuss the changes that the fund made over the past few months, as well as take a look at its updated financial report.
About The Fund
According to the fund’s website, the Virtus Convertible & Income Fund has the primary objective of providing its investors with a high level of total return. This objective makes a lot of sense considering the fund’s strategy, which is explained in great detail on the website:
The Fund seeks total return through a combination of capital appreciation and high current income.
[The Fund] invests in a diversified portfolio of domestic convertible securities and high yield bonds rated below investment grade.
Under normal circumstances, the Fund will invest at least 80% of its total assets in a diversified portfolio of convertible securities and non-convertible income-producing securities and seeks to invest at least 50% of its total assets in convertible securities, but determines its allocation based on changes in equity prices, changes in interest rates, and other economic and market factors. For the convertible portion, Voya Investment Management seeks to capture the upside potential of equities with potentially less volatility than a pure stock investment.
In searching for investment opportunities, the manager looks for issuers that will successfully adapt to change, exceed minimum credit statistics, and exhibit the most promising operating performance potential.
As mentioned in the introduction, convertible securities tend to exhibit a degree of correlation to common stocks. We can see this clearly by looking at the price performance of the iShares Convertible Bond ETF to the S&P 500 Index over the past five years:
Seeking Alpha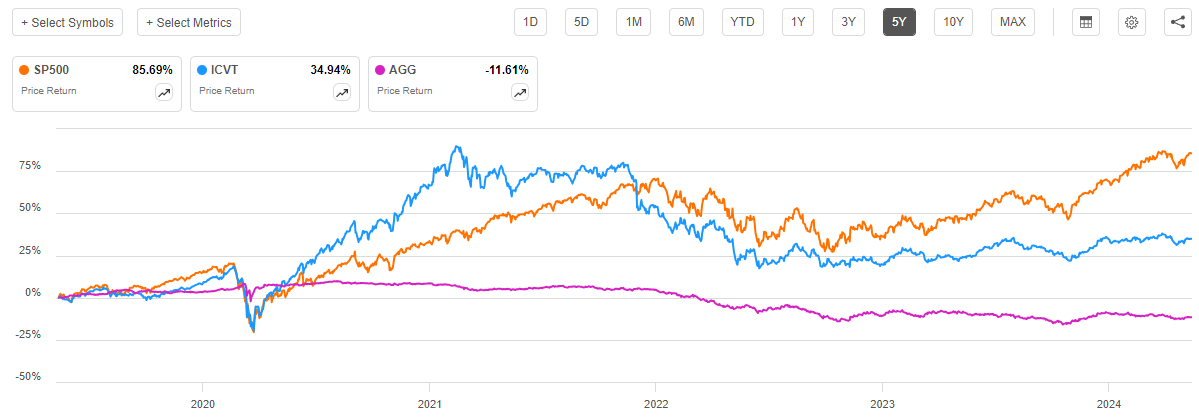
The above chart does not include the distributions paid out by either of the two bond index funds, but if it did, we would see much the same thing. In short, convertible securities frequently go up in price alongside common stocks because convertible bonds can be turned into common stocks under certain circumstances. The performance of the common stock of the issuing company will therefore play a major role in determining the price that investors are willing to pay to gain access to the conversion feature. Ordinarily, investment-grade bonds do not have a conversion feature, and so their price is entirely dictated by interest rates. As such, the fund’s objective actually makes sense, whereas the capital appreciation goal would not if it were investing in ordinary bonds.
As the quote above states, the fund aims to have 80% of its assets invested in a combination of convertible bonds and junk bonds. The fund also aims to have at least 50% of its assets invested in convertible bonds, resulting in an asset allocation of 50% convertibles/30% junk bonds/20% something else. The annual report states that the fund’s investment allocation was this as of January 31, 2024:
|
Security Type |
% of Net Assets |
|
Convertible Bonds and Notes |
84.7% |
|
Corporate Bonds and Notes |
65.4% |
|
Convertible Preferred Stocks |
6.1% |
|
Preferred Stocks |
0.1% |
|
Common Stocks |
0.0% |
|
Warrants |
0.0% |
|
Short-Term Investments |
0.0% |
|
Securities Lending Collateral |
3.0% |
The presence of securities lending collateral among the fund’s holdings might raise some eyebrows among readers. This is not something that we ordinarily see in a closed-end fund’s portfolio, although many of them do engage in securities lending as a way of enhancing their total returns. Basically, the fund lent out some of the bonds in its portfolio to a short seller, who surrendered some collateral to the fund. That collateral consisted of shares of the Dreyfus Government Cash Management Fund (DGCXX):
Fund Annual Report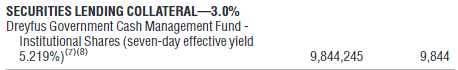
This is, as the name suggests, a money market fund that invests in short-term government and agency securities. The collateral is returned to the borrower once the borrowed bonds are returned to the fund, but meanwhile, the fund can collect a bit of interest from the collateral. Thus, the securities lending activities boost the fund’s income slightly and naturally provide the fund with more money that it can distribute to the shareholders.
The asset allocation provided above is from the fund’s annual report, which was dated January 31, 2024. The website provides a more recent asset allocation that corresponds to March 28, 2024:
Virtus Investment Partners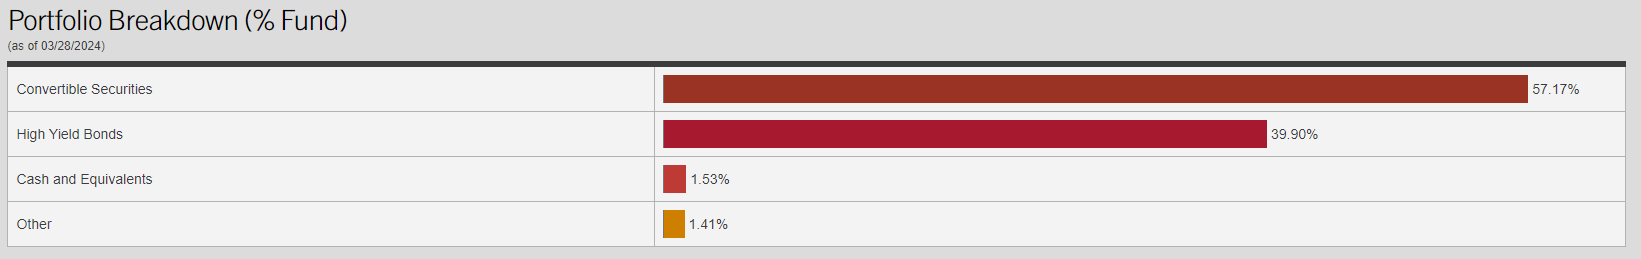
The strategy description provided on the website states that the fund will always have at least 50% of its assets in convertible bonds and 80% in a combination of convertible bonds and junk bonds. As we can clearly see here, the fund is meeting that objective, as it had 57.17% invested in convertible securities and another 39.90% invested in junk bonds at the end of March. That is a total of 97.07% of its total assets invested in just these two types of securities. The remainder of the fund is invested in cash and other things. The cash position is almost certainly held in the BlackRock Liquidity FedFund – Institutional Shares (TFDXX) money market fund, as that was the fund that the Virtus Convertible & Income Fund was using for its cash position in the annual report, and it is unlikely that it changed that in two months. It is uncertain what the “Other” position here is, but convertible bond funds do sometimes hold common stocks, so this might be a combination of common stocks and securities lending collateral just like we saw in the annual report.
In my previous article on this fund, I stated that:
Convertible securities are frequently issued by companies that are experiencing temporary financial problems or start-up companies that have very limited revenue and cash flow. This is because these companies might have difficulty obtaining financing at a reasonable price without providing investors the opportunity to earn significant capital gains from the common stock. After all, we know how well certain stocks can do following an initial public offering, especially during a bull market.
As such, we might expect that the largest positions in this fund will consist of numerous younger companies. Here is the list:
Virtus Investment Partners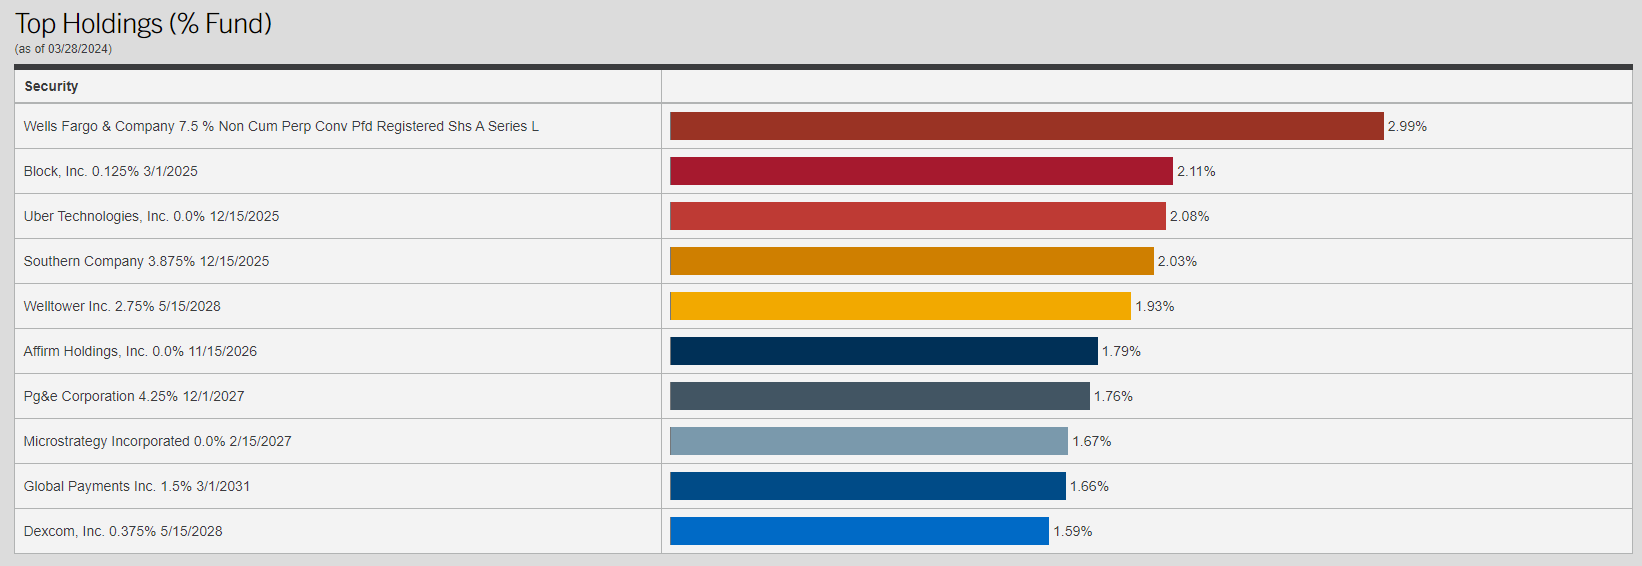
Many of these are indeed fairly young companies:
|
Company |
Formation Year |
|
Wells Fargo & Company (WFC) |
1929 |
|
Block, Inc. (SQ) |
2009 |
|
Uber Technologies (UBER) |
2009 |
|
The Southern Company (SO) |
1945 |
|
Welltower (WELL) |
1970 |
|
Affirm Holdings (AFRM) |
2012 |
|
PG&E Corporation (PCG) |
1930 |
|
MicroStrategy Incorporated (MSTR) |
1989 |
|
Global Payments (GPN) |
2000 |
|
DexCom (DXCM) |
1999 |
For the most part, those companies that were not founded within the last thirty years or so encountered some sort of financial distress that made it very difficult for them to raise money at a time when they needed it most. Wells Fargo is a good example of this, as the Series L preferred stock that comprises the largest position in this fund was issued at the height of the subprime mortgage crisis, when nobody wanted to invest in the banking sector. The convertible securities helped Wachovia (which was taken over by Wells Fargo in a government-forced merger) raise money from investors who were willing to take a gamble on the company surviving the crisis and recovering its stock price. The prospectus for these securities states:
Each share of the Series L Preferred Stock will be convertible at any time, at your option, into 32.0513 shares of our common stock (equivalent to an initial conversion price of approximately $31.20 per share of our common stock), plus cash in lieu of fractional shares, subject to adjustment as described in this prospectus supplement. The conversion rate will be adjusted as described in this prospectus supplement upon the occurrence of certain other events. The par value per share of our common stock is $3.33-1/3.
Most sources give the same conversion multiple, and Wells Fargo’s own website states that these are now convertible into its shares:
Wells Fargo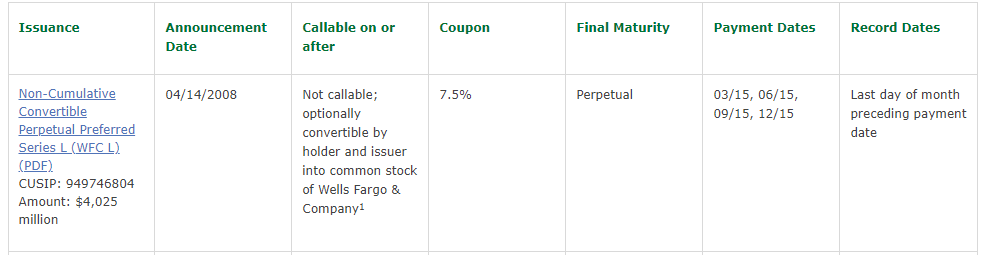
However, the Wells Fargo website states that each Series L preferred share is now convertible into 6.3814 shares of Wells Fargo common stock, as opposed to the 32.0513 shares that were initially stated in the offering document. The reason for the change is that shareholders of Wachovia got 0.1991 shares of Wells Fargo for each Wachovia share when the companies were merged. 6.3814 shares of Wells Fargo today are worth $394.82, so admittedly the conversion feature has not yet paid off for the investors who paid $1,000 each for these securities at the time of issuance. However, the investors have still received their promised 7.50% yield for the past sixteen years, so it has not been a terrible investment for income investors.
There are, of course, other convertible issues that wind up being much better bets for their purchasers, such as the convertible bonds that Tesla (TSLA) issued early in its life. For the most part, we can see that the Virtus Convertible & Income Fund will primarily generate returns via direct payments that it receives from the securities in its portfolio, but it does manage to realize common stock gains occasionally.
There have been numerous changes to the fund’s largest positions list since the date of our previous discussion on the fund:
|
Removed From Largest Positions List |
Added to Largest Positions List |
|
Palo Alto Networks (PANW) |
Uber Technologies |
|
CCF Holdings (OTC:CCFLU) |
PG&E Corporation |
|
Akamai Technologies (AKAM) |
MicroStrategy Incorporated |
|
Royal Caribbean Cruises (RCL) |
Global Payments |
|
Seagate HDD Cayman (STX) |
Dexcom |
All five of the changes shown above were made during the first half of this year, which is quite a lot for a three-month period. This does explain why the fund had a 107.00% portfolio turnover in the most recent fiscal year, however. This is a much higher turnover ratio than its peers possess:
|
Fund Name |
Portfolio Turnover |
|
Virtus Convertible & Income Fund |
107.00% |
|
Advent Convertible & Income Fund |
116.00% |
|
Calamos Convertible & High Income Fund |
40.00% |
|
Ellsworth Growth and Income Fund |
47.00% |
|
High Income Securities Fund |
52.00% |
|
Bancroft Fund |
44.00% |
(All figures are from the most recent annual report for each respective fund.)
As we can clearly see, the only fund that has a portfolio turnover that is anywhere close to that of the Virtus Convertible & Income Fund is the Advent Convertible & Income Fund. The remainder of the peer funds all have considerably lower turnover. This could be important because of the drag that heavy trading imparts on a fund. After all, it costs money to trade securities and these expenses are billed to the fund itself. While it is uncertain whether the expenses from all of this trading are directly related to the fund’s performance relative to its peers, it does seem obvious that the management’s constant movement into and out of positions is not doing it any favors as the fund is still underperforming all of its peers by a lot. We saw that in the introduction to this article.
Leverage
As is the case with most closed-end funds, the Virtus Convertible & Income Fund employs leverage as a method of boosting the effective yield that it earns from the assets in its portfolio. I explained how this works in my previous article on this fund:
Basically, the fund borrows money and then uses that borrowed money to purchase convertible securities, junk bonds, or other assets. As long as the purchased assets provide a higher yield than the interest rate that the fund has to pay on the borrowed money, the strategy works pretty well to boost the effective yield of the portfolio. This fund is capable of borrowing money at institutional rates, which are considerably lower than retail rates. As such, this will usually be the case.
It is important to note though that this strategy is not as effective today with rates at 6% as it was three years ago when rates were essentially 0%. This is because the difference between the rate at which the fund can borrow and the yield that it gets from the purchased securities is much narrower than it once was.
However, the use of debt in this fashion is a double-edged sword. This is because leverage boosts both gains and losses. As such, we want to ensure that the fund is not employing too much debt since that would expose us to an excessive amount of risk. I generally do not like a fund’s leverage to exceed a third as a percentage of its assets for that reason.
As of the time of writing, the Virtus Convertible & Income Fund has leveraged assets comprising 36.95% of its portfolio. This is a decrease from the 37.47% leverage ratio that the fund had the last time that we discussed it. The slight decrease in leverage is surprising since the fund’s net asset value is down since the January 23, 2024, publication date of the last article:
Barchart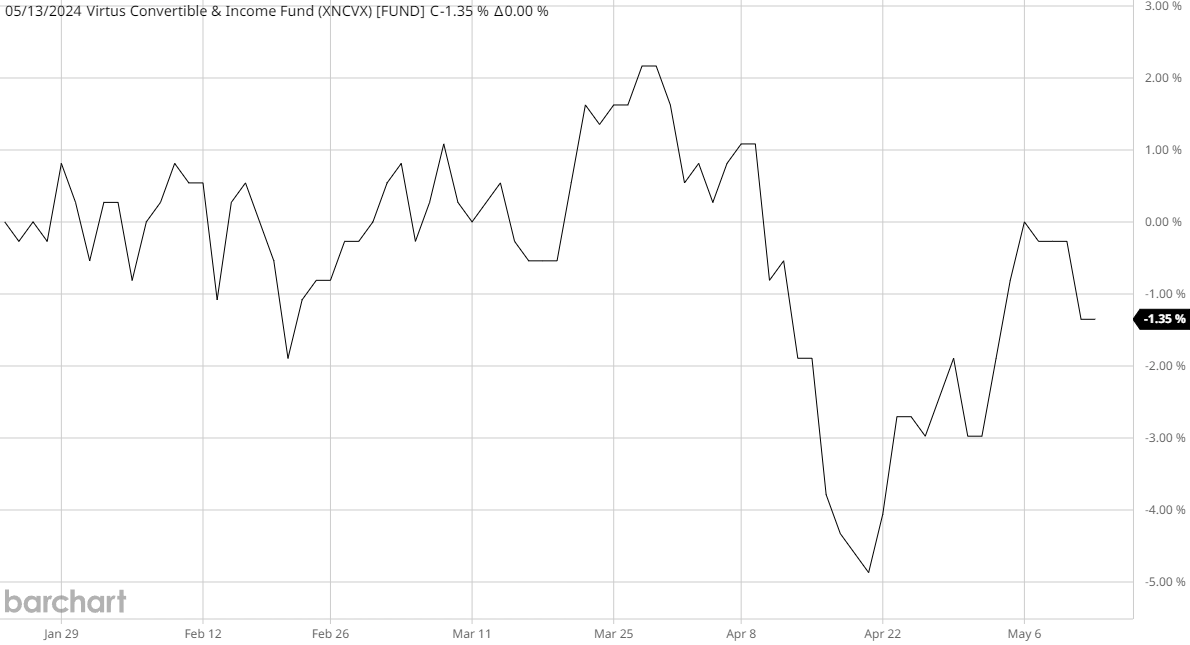
However, the fund may have paid off a bit of its leverage in the interim period. This would, in fact, be a logical move when net asset value declines, since the fund’s managers may not want its leverage to get too high. We can see a very steep decline that occurred in mid-April, so it is possible that the fund’s leverage was intentionally reduced at that time, but that is simply speculation on my part.
The Virtus Convertible & Income Fund has more leverage than the one-third maximum level that we would ordinarily prefer. Here is how it compares to its peers:
|
Fund Name |
Leverage Ratio |
|
Virtus Convertible & Income Fund |
36.95% |
|
Advent Convertible & Income Fund |
42.88% |
|
Calamos Convertible & High Income Fund |
36.97% |
|
Ellsworth Growth and Income Fund |
24.00% |
|
High Income Securities Fund |
0.00% |
|
Bancroft Fund |
21.00% |
(All figures courtesy of CEF Data.)
As we can see, the Virtus Convertible & Income Fund has a higher level of leverage than quite a few of its peers. However, it is not ridiculously out of line with all of them. The two highest-performing funds over the past five years both have higher levels of leverage, so it does not appear that the Virtus Convertible & Income Fund is using an excessive amount of leverage for the strategy that it is employing. The fact that it has apparently reduced its leverage over the past few months is still something that we should appreciate, though.
Distribution Analysis
The Virtus Convertible & Income Fund aims to provide its investors with a high level of total return. As with all closed-end funds, this total return is primarily delivered to its shareholders via distribution payments. The fund pays a monthly distribution of $0.0340 per share ($0.408 per share annually), which works out to a 12.83% yield at the current price. Unfortunately, the fund’s distribution has steadily declined over the years:
CEF Connect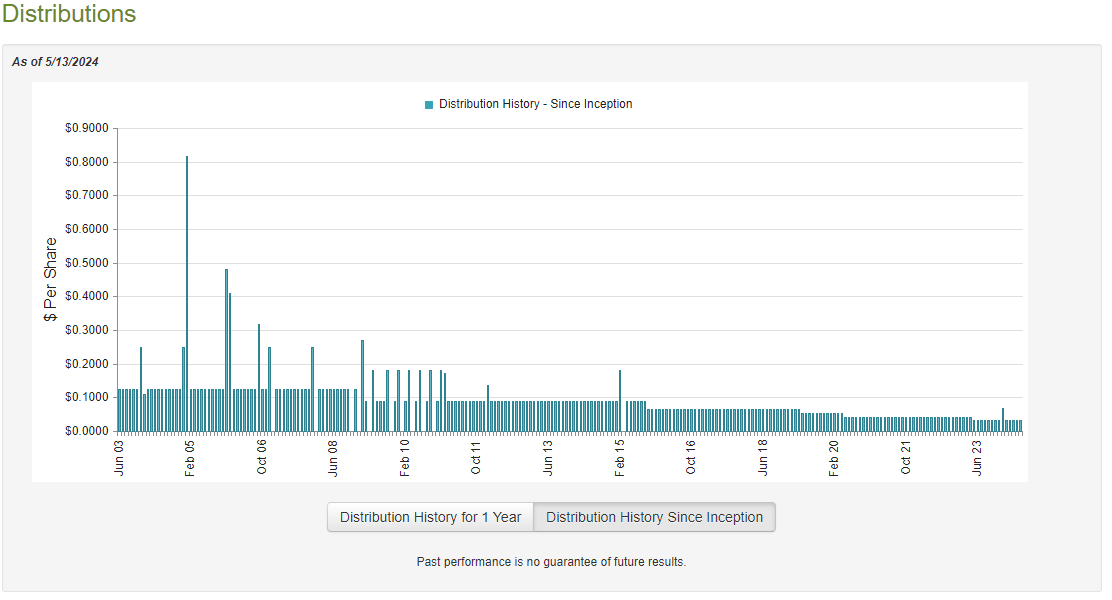
From the previous article:
This seems likely to be quite discouraging to those investors who are seeking to receive a consistent and safe income from the assets in their portfolios. It is also somewhat problematic for anyone who depends on their portfolio income to provide the income that they need to pay their bills and finance their lifestyles in today’s environment. After all, one of the defining characteristics of the economy over the past two or three years has been a very high level of inflation. This inflation has made every expense that we incur increase and so it requires a higher level of income to sustain our lifestyles over time. This means that we need a rising level of income, not a declining one. This fund has provided the exact opposite, which is certainly not what we want.
We should still have a look at the fund’s finances to check on its ability to sustain the current payout, though, since anyone who purchases the fund today will not be affected by previous cuts. The most recent document available to us is the fund’s annual report, a link to which was provided in the introduction. This document corresponds to the full-year period that ended on January 31, 2024, and as such is newer than the report that was available at the time of our previous discussion. As such, it would be quite useful for an update on the fund’s finances.
For the full-year period that ended on January 31, 2024, the Virtus Convertible & Income Fund received $21.848 million in interest payments and $2.698 million in dividends from the securities in its portfolio. When this is combined with a small amount of income from other sources (such as securities lending), it gives the fund a total investment income of $24.595 million. The fund paid its expenses out of this amount, which left it with $13.007 million available to the shareholders. This was not nearly enough to cover the $38.409 million that the fund paid out in distributions over the period, which is concerning.
The fund was unable to make up the difference with capital gains. For the full-year period, the fund reported net realized losses of $35.798 million that were partially offset by $31.239 million of net unrealized gains. Overall, the fund’s net assets declined by $35.586 million after accounting for all inflows and assets.
The fund therefore failed to cover its distribution over the period, which is nothing new for this fund. For the full-year period that ended on January 31, 2023, the fund’s net assets declined by $135.841 after accounting for all incoming and outgoing transactions. Thus, we have had two years of failure to cover its distribution, which certainly explains why the market appears to believe that the fund may have to cut the payout.
Valuation
Shares of the Virtus Convertible & Income Fund currently trade at a 12.33% discount to net asset value. This is a more attractive entry point than the 11.64% discount that the shares have averaged over the past month.
Conclusion
In conclusion, the Virtus Convertible & Income Fund continues to look like a poor choice for income-seeking investors despite its high yield. The fund failed to cover its distribution for the second year in a row and is depleting its asset base trying to maintain the distribution at the current level. The fund’s concept is fairly novel, as there are not many funds that use similar strategies, but all the ones that do outperform this one by a lot.