NZDUSD technicals
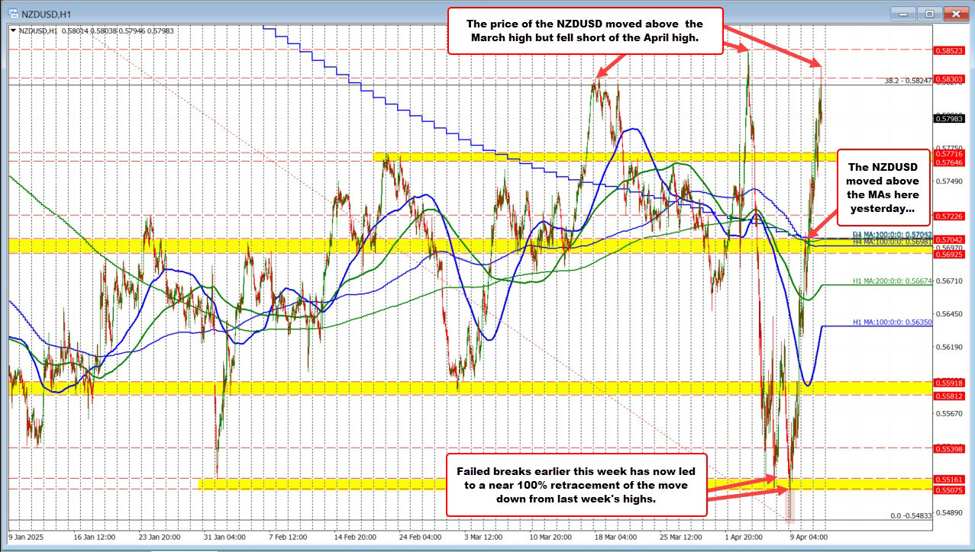
The NZDUSD reversed sharply higher after bottoming at 0.5483 on Wednesday, following a steep decline from last week’s high at 0.5852. The rebound nearly erased the entire drop, with price reaching 0.5839 — just 13 pips shy of the recent peak.
That’s a powerful roundtrip and a clear signal of heightened volatility.
The move off the lows this week cleared a critical resistance zone, including:
-
The 100- and 200-bar MAs on the 4-hour chart
-
The 100-day moving average
All of which clustered between 0.5698 and 0.5704, and were convincingly broken yesterday. That gave buyers the green light for further gains.
However, the rally stalled near the 38.2% retracement of the decline from the September 2024 high, which sits at 0.58247. With today’s high at 0.5839, price also fell short of the 0.5852 high from last week, suggesting buyers blinked at a key resistance confluence.
What now?
The pair is now back below both the retracement and recent swing highs, trading near 0.5799. Immediate support comes in at the 0.5764–0.57716 swing area. A break below that zone could shift short-term momentum back toward the moving average cluster near 0.5704 — a key area that will define whether this rebound was a one-off or the start of something more sustained.
NZDUSD hourly