Fundamental
Overview
The USD has been
generally under pressure since the benign US CPI report last week as the
hawkish expectations subsided and the market switched its focus from inflation
back to growth. This triggered a positive risk sentiment with risk assets like
stocks and bitcoin gaining ground. Such an environment is generally negative
for the greenback and positive for commodity currencies like the NZD.
NZDUSD Technical
Analysis – Daily Timeframe
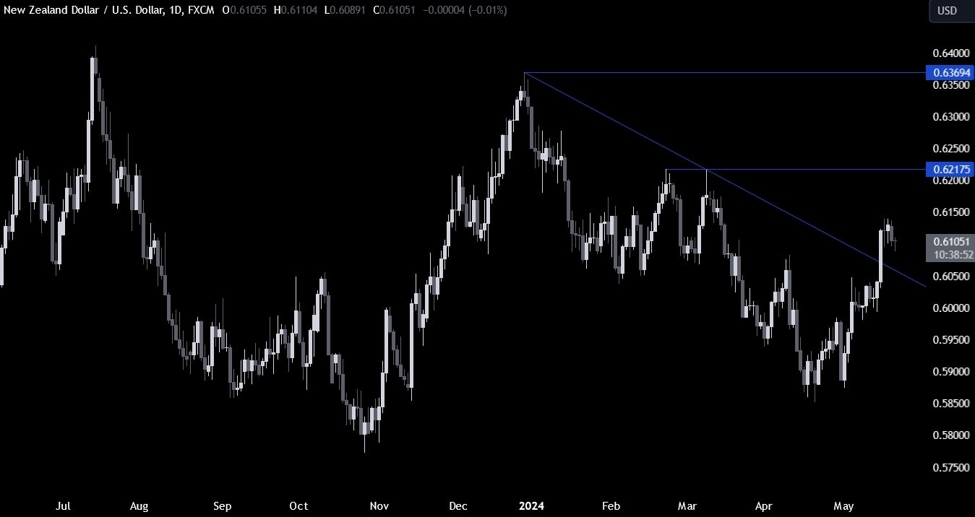
NZDUSD Daily
On the daily
chart, we can see that NZDUSD broke above the trendline
following the US CPI report and consolidated around the highs. This has opened
the door for a rally into the 0.6217 swing level and should give the buyers
more conviction.
NZDUSD Technical
Analysis – 4 hour Timeframe
NZDUSD 4 hour
On the 4 hour
chart, we can see that from a risk management perspective, the buyers will have
a much better risk to reward setup around the upward trendline where they will
also find the 50% Fibonacci
retracement level for confluence.
The sellers, on the other hand, will want to see the price breaking lower to
invalidate the bullish setup and position for a drop into the 0.60 handle.
NZDUSD Technical
Analysis – 1 hour Timeframe
NZDUSD 1 hour
On the 1 hour
chart, we can see that we’ve been stuck in a range between the 0.6095 support
and 0.6140 resistance. A break to the downside should see the sellers extending
the drop into the trendline around the 0.6070 level. On the other hand, a breakout
to the upside is unlikely today without a strong catalyst as we have the upper
limit of the average
daily range right at the resistance.
Upcoming
Catalysts
Tomorrow we have the RBNZ policy decision where the central
bank is expected to keep everything unchanged. On Thursday, we will get the
latest US PMIs and Jobless Claims figures.