Fundamental
Overview
The USD has been generally
weaker this week after the strength seen last week due to some risk off
sentiment. In fact, it looks like it’s just sentiment that’s been driving the
market recently as fundamentally the soft US inflation figures just consolidated the market’s
expectation of two cuts for this year despite a bit more hawkish than expected FOMC decision.
The NZD, on the other hand,
got pressured mainly because of the risk-off sentiment and the US Dollar
strength. The mood in the market has been gradually improving this week and we
saw the Kiwi gaining ground as a consequence.
We also had some good news
for New Zealand today as the Q1
GDP showed positive growth and took the economy out of the technical recession.
GDP is generally not a strong market moving catalyst because it’s old news but
nonetheless that confirms a pickup in growth in the first part of the year.
NZDUSD
Technical Analysis – Daily Timeframe
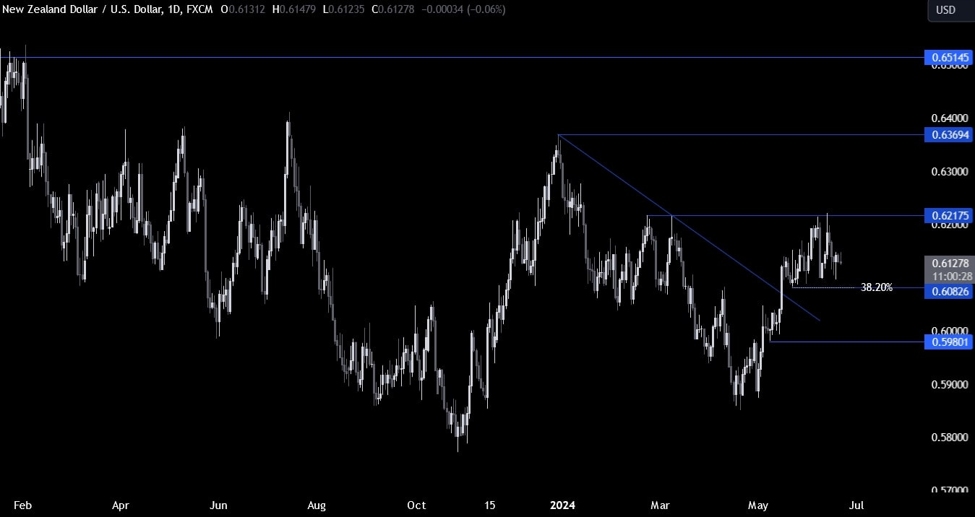
NZDUSD Daily
On the daily chart, we can
see that NZDUSD bounced near the key support
around the 0.6082 level where we have also the 38.2% Fibonacci retracement level for confluence.
The buyers stepped in
around the bottom of the range and they are now targeting a rally back into the
0.6217 resistance. That’s where we can expect the sellers piling in again with
a defined risk above the resistance to position for a drop back into the bottom
of the range.
NZDUSD Technical
Analysis – 4 hour Timeframe
NZDUSD 4 hour
On the 4 hour chart, we can
see that the price action has been mostly rangebound between the 0.6082 support
and the 0.6217 resistance. These will be the key levels that the market will need
to break to start a more sustained trend. For now, we could keep bouncing
around as the market awaits new catalysts.
NZDUSD Technical
Analysis – 1 hour Timeframe
NZDUSD 1 hour
On the 1 hour chart, we can
see that we have a strong resistance zone around the 0.6145 level where the
price got rejected from several times in the past days.
The buyers will want to see
the price breaking higher to gain more conviction and increase the bullish bets
into the 0.6217 level. The sellers, on the other hand, will likely keep on
leaning on that resistance to position for a drop back into the 0.6082 support.
The red lines define the average
daily range for today.
Upcoming
Catalysts
Today we have the US Housing Starts, Building Permits and the US Jobless
Claims figures. Tomorrow, we conclude the week with the US PMIs.