A lot of Hezballah pagers blew up yesterday but what will it do to the oil market? Some people thought oil might surge but the chart and price action does not care about what we think. Here is oil technical analysis I see but please do your own research and trade at your own risk.
Oil technical analysis after Hezbollah: Bulls trapped.
Oil Technical Analysis: Failed Breakout and Market Sentiment Shift
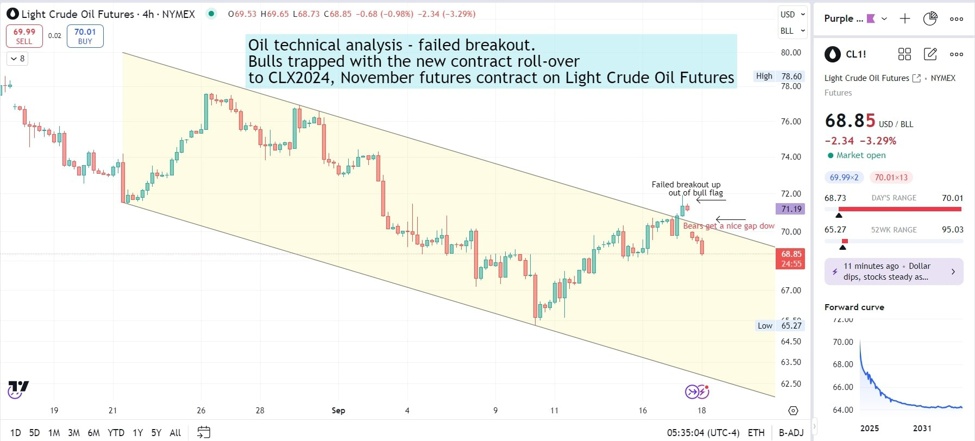
The oil market has recently experienced significant volatility, as illustrated in the Light Crude Oil Futures (CL1!) chart. Traders were caught off guard by a failed breakout and a subsequent bearish momentum, which reflects a shift in market sentiment. Here’s a breakdown of the key technical events unfolding.
Failed Breakout and Bull Trap
The chart shows a failed breakout from a bull flag pattern, a bearish signal that typically indicates a reversal in price momentum. After an attempted breakout above the upper resistance, bulls were trapped with the breakout proving short-lived. This led to a swift price reversal, disappointing those who were expecting further upward movement.
The contract rollover to the November futures (CLX2024) adds another layer of complexity to this technical setup. As the contract switched, bullish traders were trapped in their positions, unable to capitalize on expected gains. This failure often creates a scenario where traders rush to close long positions, fueling bearish pressure.
Downward Price Channel
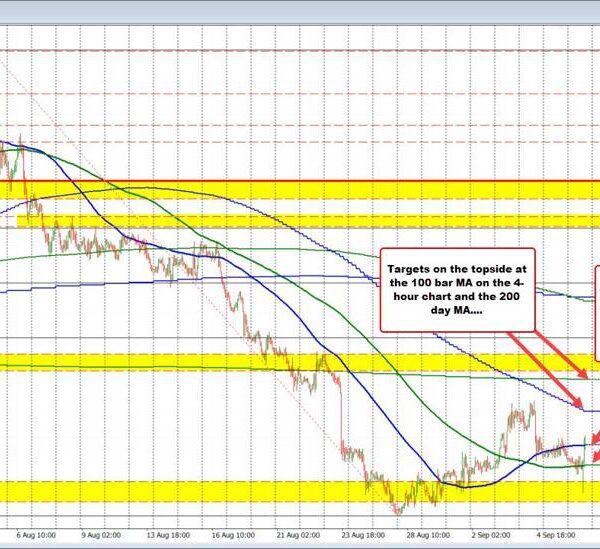
Since mid-August, oil prices have been trending within a descending channel. This sustained downtrend is highlighted by lower highs and lower lows, indicating that bears are currently in control of the market. The recent failed breakout attempt suggests that the downward pressure remains strong, with bulls unable to break free from the prevailing bearish momentum.
At the time of writing, oil prices are hovering around $68.85, representing a 3.29% decline. The failed breakout at $71.19 marked the peak of this brief rally attempt, but the market quickly reversed, confirming resistance at this level.
Bears in Control: Gap Down Confirms Sentiment
The most recent action saw bears taking advantage of a gap down, further solidifying their hold on the market. This gap reinforces the bearish sentiment, with the price now struggling to maintain a foothold around the $68-$69 range. Given the failure to maintain support above $71, traders may expect additional downside movement, potentially targeting previous lows around $65.27.
Moving Forward: Key Levels to Watch
-
Resistance at $71.19: The failed breakout and subsequent bearish action confirm this as a key resistance level. Any future upward attempts will need to decisively clear this level to regain bullish momentum.
-
Support at $68.85: The current price is testing this support zone. A break below could open the door for further downside, with the next major support seen near $65.27.
-
$65.27 Support Level: This represents a critical psychological level that, if broken, could accelerate the downward trend in the oil market.
Conclusion: Bearish Outlook Continues
With the failed breakout from the bull flag pattern and a significant bearish gap down, the current outlook for Light Crude Oil Futures remains bearish. Bulls are struggling to regain control, and until they can break above the key resistance at $71.19, the downward trend will likely persist.
Traders should watch for further downside tests of the support levels mentioned, and any bounce attempts should be monitored for potential short-term trading opportunities.
In this environment, risk management is crucial, as the market remains highly volatile and prone to sudden shifts, particularly with contract rollovers and macroeconomic factors influencing oil prices.