SolStock
QMOM strategy
Alpha Architect U.S. Quantitative Momentum ETF (NASDAQ:QMOM) is an actively managed ETF launched on 12/1/2015. It has a portfolio of 50 stocks and an expense ratio of 0.29%. The fund’s strategy is inspired by the book Quantitative Momentum (Wiley), whose authors Dr Wesley Gray and Dr Jack Vogel are respectively CEO and CIO of Alpha Architect. I think any investor seriously interested in data-driven investing should read this book, as well as Quantitative Value (Wiley) by Dr Gray and Tobias Carlisle. This other book is at the origin of Alpha Architect U.S. Quantitative Value ETF (QVAL), reviewed here.
As described in the prospectus by Alpha Architect, the fund “employs a multi-step, quantitative, rules-based methodology to identify a portfolio of approximately 50 to 200 equity securities with the highest relative momentum”. The investing universe includes stocks traded on a U.S. exchange with a market capitalization of at least $1 billion. REITs, ADRs and stocks with less than 12 months of historical data are excluded. Proprietary screens are used to eliminate stocks with specific characteristics, in particular those with a poor 6-month or 9-month price return or a high beta. Next, the stocks with the highest trailing 12-month return, excluding the most recent month, are highlighted. Finally, a series of screens focused on momentum quality makes the final selection. Constituents are equal-weighted. The portfolio is reconstituted typically every 2 months and at least quarterly. The portfolio turnover rate in the most recent fiscal year was 193%.
QMOM portfolio
The portfolio has a tilt to mid-cap companies, which weigh about half of asset value. This article will use as a benchmark the Russell 1000 Index, represented by iShares Russell 1000 ETF (IWB).
The heaviest sectors are industrials (25.8% of asset value), consumer discretionary (19.2%) and information technology (15.2%). Other sectors are below 10%. Compared to the benchmark, QMOM overweights industrials, consumer discretionary, utilities and materials. It underweights mostly technology, healthcare, communication and energy. Real estate is ignored on purpose by the strategy. The sector breakdown is not structurally linked to the momentum investing style: it may vary depending on sector momentum rotations.
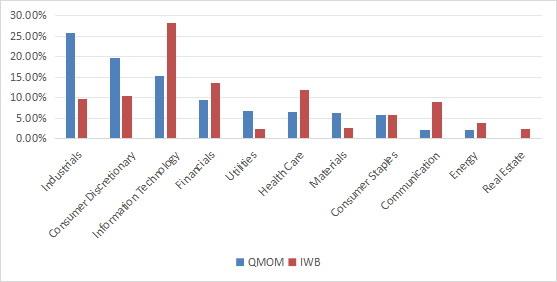
Sector breakdown (chart: author; data: Fidelity, iShares)
Positions are in equal weight at every reconstitution, but they may vary with price action. The current top 10 holdings, listed in the next table, represent 20.8% of asset value. All weights are close to 2%, so risks related to individual companies are low.
|
Ticker |
Name |
Weight% |
EPS growth %TTM |
P/E TTM |
P/E fwd |
Yield% |
|
Sprouts Farmers Market, Inc. |
2.16% |
24.63 |
25.91 |
24.39 |
0 |
|
|
FTAI Aviation Ltd. |
2.15% |
610.44 |
35.78 |
40.65 |
1.53 |
|
|
Fair Isaac Corp. |
2.11% |
27.09 |
65.21 |
52.64 |
0 |
|
|
Vistra Corp. |
2.09% |
209.14 |
23.86 |
18.81 |
1.05 |
|
|
CrowdStrike Holdings, Inc. |
2.08% |
146.22 |
875.51 |
80.87 |
0.00 |
|
|
NRG Energy, Inc. |
2.05% |
-119.02 |
N/A |
12.85 |
2.09 |
|
|
Toll Brothers, Inc. |
2.05% |
12.24 |
9.86 |
9.34 |
0.72 |
|
|
Evercore, Inc. |
2.04% |
-35.35 |
30.31 |
18.61 |
1.66 |
|
|
Spotify Technology S.A. |
2.04% |
85.10 |
N/A |
60.11 |
0 |
|
|
Abercrombie & Fitch Co. |
2.03% |
9999.00 |
20.80 |
16.66 |
0 |
Data: Portfolio123
Fundamentals
Unexpectedly, the fund is cheaper than the Russell 1000 regarding price/earnings, price/sales and price/cash flow ratios, as reported in the next table. Price-to-book is a bit higher (however, this is one of the least reliable value metrics). Growth rates are superior to the benchmark. The aggregate cash flow growth is especially impressive.
We may find very surprising that momentum comes here with good value metrics. However, as I wrote in the previous section, the sector breakdown may vary with sector rotations, and aggregate valuation metrics depend a lot on it.
|
QMOM |
IWB |
|
|
Price/Earnings TTM |
20.02 |
23.91 |
|
Price/Book |
4.95 |
4.08 |
|
Price/Sales |
1.96 |
2.65 |
|
Price/Cash Flow |
13.87 |
16.45 |
|
Earnings growth |
26.72% |
21.43% |
|
Sales growth |
12.24% |
8.63% |
|
Cash flow growth |
61.44% |
8.50% |
Performance
Since 1/1/2016 QMOM has lagged the Russell 1000 by 1.4% in annualized return. Additionally, risk metrics (volatility and drawdown) are significantly higher, as reported below.
|
Total Return |
Annual.Return |
Drawdown |
Sharpe ratio |
Volatility |
|
|
QMOM |
163.05% |
12.28% |
-39.13% |
0.56 |
22.62% |
|
IWB |
191.61% |
13.68% |
-34.60% |
0.78 |
16.18% |
Data: Portfolio123
Nevertheless, QMOM is 9.2% ahead of IWB over the last 12 months:
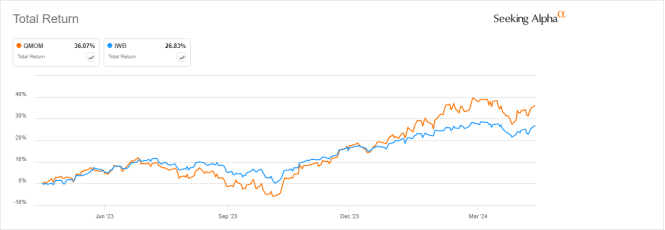
QMOM vs. SPY, 12-month return (Seeking Alpha)
QMOM vs competitors
The next table compares characteristics of QMOM and five other momentum ETFs:
- Invesco S&P 500 Momentum ETF (SPMO)
- iShares MSCI USA Momentum Factor ETF (MTUM)
- Invesco Dorsey Wright Momentum ETF (PDP)
- JPMorgan U.S. Momentum Factor ETF (JMOM)
- Vanguard U.S. Momentum Factor ETF (VFMO)
|
QMOM |
SPMO |
MTUM |
PDP |
JMOM |
VFMO |
|
|
Inception |
12/1/2015 |
10/9/2015 |
4/16/2013 |
3/1/2007 |
11/8/2017 |
2/13/2018 |
|
Expense Ratio |
0.29% |
0.13% |
0.15% |
0.62% |
0.12% |
0.13% |
|
AUM |
$213.65M |
$1.18B |
$9.86B |
$1.23B |
$887.70M |
$544.47M |
|
Avg Daily Volume |
$1.09M |
$27.13M |
$170.68M |
$2.32M |
$8.55M |
$4.88M |
|
Holdings |
52 |
102 |
128 |
103 |
280 |
594 |
|
Top 10 |
20.78% |
62.98% |
42.77% |
24.44% |
19.47% |
13.09% |
|
Turnover |
193.00% |
81.00% |
111.00% |
140.00% |
43.00% |
73.00% |
Data: Seeking Alpha
QMOM is the smallest fund of this group regarding assets under management, the least liquid in dollar volume, and has the highest turnover. The next chart plots total returns, starting on 2/19/2018 to match all inception dates. QMOM had the highest spike in the post-pandemic market recovery, but it is in the middle of the pack for the whole period. SPMO is the best performer.
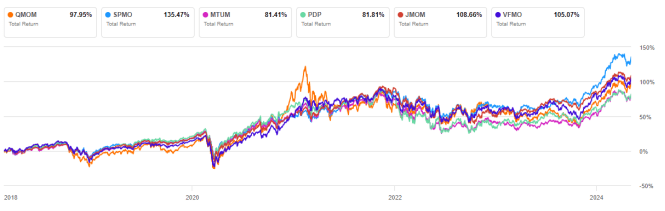
QMOM vs competitors, since 2/19/2018 (Seeking Alpha)
Apart from the 2020-2021 rally, QMOM has steadily underperformed SPMO since its inception in December 2015:
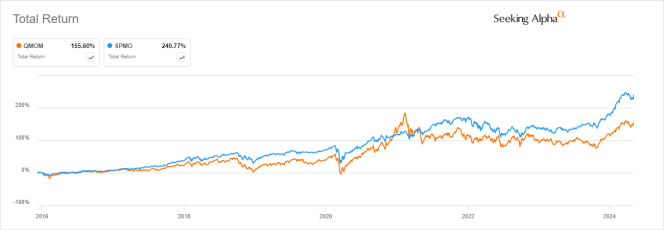
QMOM vs SPMO, since inception (Seeking Alpha)
Takeaway
Alpha Architect U.S. Quantitative Momentum ETF is an actively managed fund holding 50 uptrending stocks in equal weight. The portfolio is well diversified across sectors and holdings, but quite heavy in mid-caps and industrials. Surprisingly, QMOM looks attractive regarding both valuation and fundamental growth metrics. However, the fund’s track record is mixed: it has materially outperformed in some time frames (especially in 2024 and in the 2020-2021 rally), but overall performance since inception is underwhelming compared to the S&P 500 Momentum Index (represented by SPMO). In conclusion, I think QMOM is an excellent swing-trading instrument, but an average long-term investment.