Rasi Bhadramani
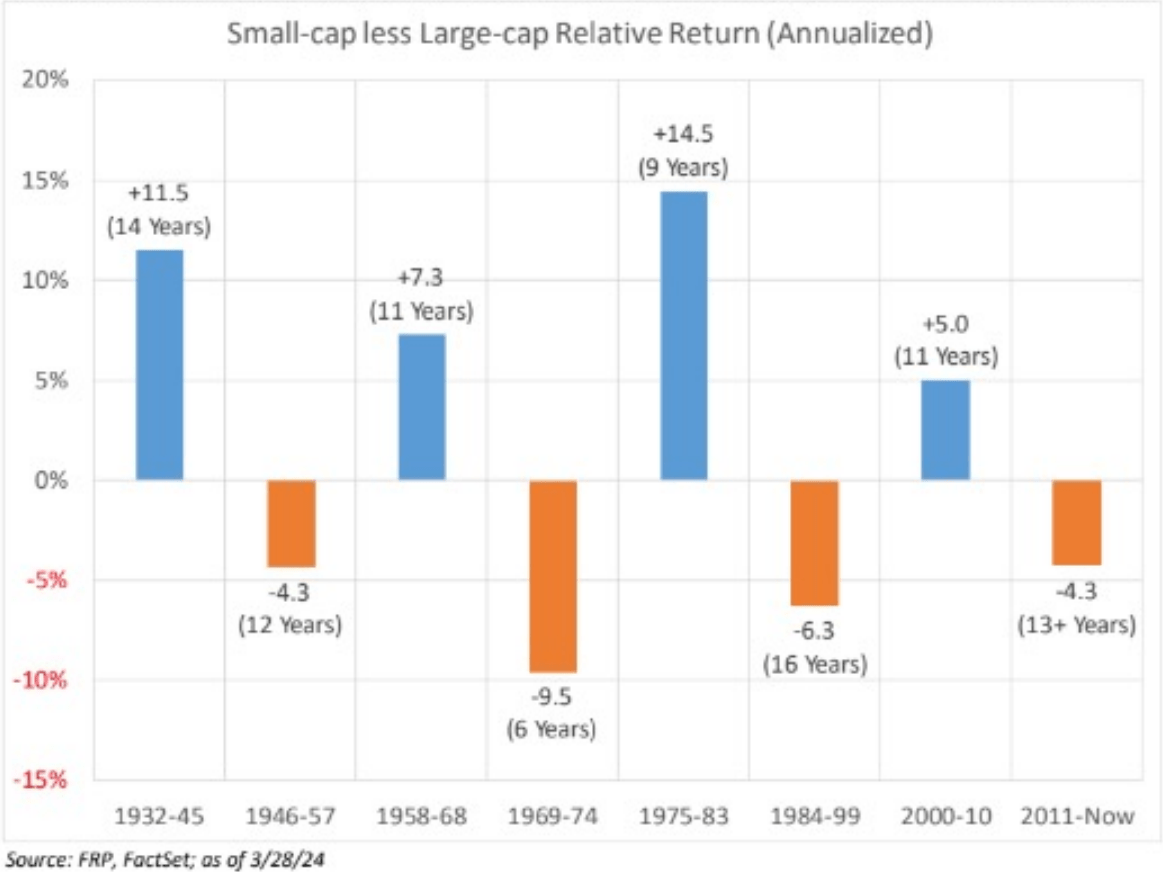
Small vs. Large Caps
In Q1 2024, the Riverwater Sustainable Value Strategy outperformed its benchmark, the Russell 2500 Value Index. Small-caps continued what appears to be a new bull market since hitting bottom last October. Small-caps still have significant ground to cover, having last peaked in 2021, while large-caps have continued to hit record highs. Large-caps once again outpaced small-caps this quarter, marking the 14th year of large-cap dominance. The recent market leaders’ performance is fueled by the remarkable growth of artificial intelligence (‘AI’) and the anticipation of rate cuts by the Fed this year. Many small-caps have exposure to AI, and our portfolio has benefited, as we will discuss below.
Small caps have lagged by more than 4% per year during the latest large-cap cycle
The “what,” “where,” “when,” and “how” may provide straightforward answers regarding the performance gap between large and small-caps . However, it’s the “WHY” that holds the greatest significance, offering valuable insight into potential future trajectories.
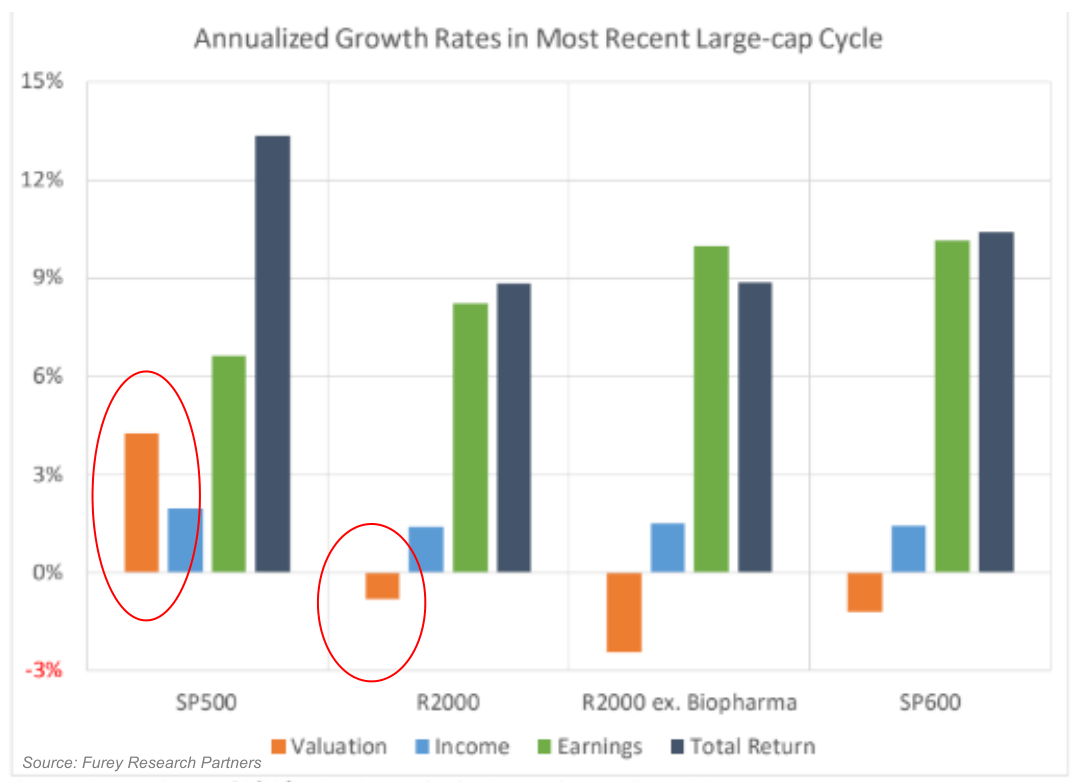
In the current cycle, large-caps have outperformed due to growth in the multiples investors are willing to pay for their earnings. Conversely, small-caps have experienced a decline in investor willingness to pay for their earnings, despite exhibiting faster earnings growth compared to their large-cap counterparts, as illustrated below.
The notion that the current cycle could persist indefinitely is one we are willing to wager against! While Large-caps outperformed for 16 years in the longest cycle since 1932, the severe concentration of the largest stocks in the S&P 500, and their elevated valuation, lead us to believe that we’re in the 9th inning of their outperformance. While extra innings may be possible, the next five and ten-year outlook for small versus large appears highly enticing.
Macro Landscape and Strategy Positioning
Significant economic and geopolitical concerns loom on the horizon. At the forefront of our worries are several issues: inflation, which still persists above the Fed’s comfort level; an extensive list of geopolitical tensions; and the potential for election-related volatility. To mitigate these concerns, we focus on investing in quality businesses led by management teams capable of adapting to the constantly evolving environment. Over 99% of our portfolio companies are profitable and we pay close attention to their use of debt. And we aim to pay a fair price for what we acquire and hold. Given the macro concerns outlined above, it’s not surprising that quality factors like return on capital have begun to outperform; we believe that outperformance will continue.
Portfolio Attribution
This quarter’s alpha can be solely attributed to stock selection, particularly in Industrials.
Industrial outperformance was widespread among our six holdings, with every industrial company in our portfolio increasing its market value in the quarter. We anticipated that achieving 100% positive returns would surpass the benchmark, prompting us to delve into that analysis. Not surprisingly, of the 280 industrials in the benchmark, only 66% saw gains in the quarter. We’ve done a decent job identifying outperformers. Notably, Modine Inc. (MOD) stood out this quarter, and we extensively discussed our thesis on the stock in our previous letter. A significant aspect of our thesis revolves around data center growth, which shows no signs of slowing down. While estimates vary, most forecasts predict a doubling of data center demand by
2030 at the slowest pace, or as early as 2026 at the fastest. Modine is well positioned to capitalize on this trend, although the market has very much recognized its potential. We now believe the stock is close to fairly valued, but we remain optimistic and intend to hold it as long as business fundamentals remain robust.
On the other hand, our weakest sector was Communication Services, primarily due to the performance of our sole holding in the sector, Iridium Communications (IRDM). Iridium has been part of our strategy since 2017, with our positions adjusted through trimming and adding over the years. Despite a recent decline, we are inclined towards increasing our holdings rather than reducing them as it is a sub 2% position. The stock experienced a 36% decline in the quarter and is now down over 50% from its 2023 high. The downturn stemmed from the severed relationship with Qualcomm (QCOM), which was intended to enable Qualcomm chips access to the Iridium satellite network, allowing Android phones with Qualcomm chips to have satellite-enabled texting capabilities worldwide. While the termination was disappointing, we see potential with other partners and believe in other growth drivers that will sustain value creation. Furthermore, the company boasts a robust balance sheet with substantial free cash flows.
Strategy Additions
We added three new companies into the strategy during the quarter: New York Community Bank (NYCB), Hudson Technologies, Inc. (HDSN), and Louisiana Pacific (LPX). Additionally, we augmented our position in Limoneira (LMNR).
Our interest in NYCB had been long standing, and we initiated a small position. We had been following NYCB for a number of quarters and initiated a very small position. The recapitalization of the bank’s balance sheet by an experienced and well-connected team gave us confidence to follow their lead. Currently trading at less than 50% of its tangible book value, NYCB stands significantly below typical industry valuations where most banks trade for over 1x tangible book, with many exceeding 2x. We anticipate that with time, the new team can steer the bank back on course, aligning its valuation with industry standards.
Hudson Technologies was previously discussed in our MICRO Strategy letter last quarter, and our enthusiasm for it prompted us to include it in the Sustainable Value Strategy as well. Presently, we hold four positions in the strategy that are also part of the Micro portfolio, collectively representing less than 15% of our AUM.
We discussed a search for a material name after we sold FMC last year. We had been following LPX for a number of quarters and had multiple conversations and meetings with the management team. Our primary thesis revolves around its transition from a commodity oriented Strand Board (‘OSB’) manufacturer to a specialty siding company. We anticipate increased margins and returns, while also appreciating the environmental footprint improvement accompanying the transition.
Stock Sales
During the quarter, we divested two positions: Talos (TALO) and Lincoln Electric (LECO). TALO’s announcement regarding the sale of its carbon capture division prompted our decision. Although the sale resulted in a gain, the division was integral to their ambition of achieving carbon negativity by 2030.
Furthermore, we grew uneasy with their ongoing acquisition pace and operational challenges in the upstream division. As for Lincoln Electric, we opted to sell due to its current valuation exceeding our typical comfort zone. While it remains a stellar company, we anticipate potential corrections in the future that might offer us another opportunity to consider ownership.
Company Deep Dive: Atkore Inc.
Atkore Inc. (ATKR) specializes in products tailored for the electrical sector. ATKR caters to various segments including electrical, safety, and infrastructure. Under the Electrical division, ATKR manufactures essential components for constructing electrical power systems such as conduit, cable, and installation accessories. Meanwhile, the Safety and Infrastructure segment produces solutions for metal framing, mechanical pipe, perimeter security, and cable management, ensuring the protection and reliability of critical infrastructure. With operations spanning pivotal and emerging sectors of the economy, ATKR is well-positioned, particularly as we transition towards a future where electricity takes center stage.
Operating in thematic markets experiencing secular growth, ATKR is well-positioned in key sectors such as the solar industry, data centers and EV batteries where ATKR plays a crucial role as a supplier of electrical components. Sustained demand for solar products should continue, driven partly by policy initiatives like bringing manufacturing back to the US from China. Additionally, the growing energy consumption of data centers due to advancements in Artificial Intelligence (‘AI’) are bolstering ATKR’s prospects. While recent EV sales may have slowed, the long-term outlook remains promising. It’s worth noting that these end markets are still in their infancy, presenting significant growth potential.
ATKR has demonstrated strong execution of their business plan, marked by product innovation, successful acquisitions, and prudent capital allocation. These efforts have paved the way for opportunities in revenue growth and margin expansion. Revenue has grown 13.9% on a 5-year compounded basis and gross margins have expanded nearly 10% during the same time period. To show confidence to shareholders, ATKR recently introduced a quarterly dividend of $0.32/share. Their strong free cash flow and modest debt levels should allow them to consistently grow their dividend on an annual basis. Though we see ATKR investing the majority of its capital back into the business
Moreover, ATKR remains committed to ESG metrics and sustainability. ATKR continues to improve upon and enhance their ESG targets. They are an important supplier to companies that have an overall impact on reducing emissions.
We are bullish on the ATKR opportunity, but our analysis also considers potential risk or downside of the equity price. One concern Wall Street has with ATKR is that its demand surge during the COVID pandemic may have been temporary. We believe this short-sighted view overlooks ATKR’s broader strategy, including its acquisition prowess, strong customer relationships, continued product demand, and prudent pricing strategy.
Pre-COVID earnings were below $5.00, but post COVID, earnings guidance for 2024 is forecasted to reach $17.00 at the midpoint. Interestingly, despite this substantial earnings growth, the stock is currently trading at a similar valuation to pre-COVID levels and at a discount compared to its peers and the broader market. We anticipate multiple expansion as ATKR continues to deliver on its growth trajectory. Recently, the stock has moved higher, but we are still optimistic ATKR will continue to perform favorably.
We remain optimistic on the outlook for ATKR, given their strong end markets, their ability to return capital to shareholders and for the stock to re-rate to its peer group.
As always thank you for your trust and confidence and please reach out with any questions.
Adam Peck, Founder & CIO
Sustainable Value Strategy: Largest Contributors and Detractors – Q1 2024
|
5 Best – Absolute Contribution |
|||
|
Ticker |
Company |
Average Weight |
Contribution |
|
MOD |
Modine Manufacturing Company |
4.58% |
232 bps |
|
CROX |
Crocs, Inc. |
3.05% |
143 bps |
|
ATKR |
Atkore Inc |
5.39% |
101 bps |
|
AZZ |
AZZ Inc. |
2.92% |
93 bps |
|
ICFI |
ICF International, Inc. |
4.92% |
64 bps |
|
5 Best Total |
20.86% |
633 bps |
|
|
5 Worst – Absolute Contribution |
|||
|
Ticker |
Company |
Average Weight |
Contribution |
|
IRDM |
Iridium Communications Inc. |
1.42% |
-69 bps |
|
HDSN |
Hudson Technologies, Inc. |
0.60% |
-39 bps |
|
PLXS |
Plexus Corp. |
1.35% |
-22 bps |
|
LMNR |
Limoneira Company |
4.37% |
-21 bps |
|
WAL |
Western Alliance Bancorp |
4.63% |
-17 bps |
|
5 Worst Total |
12.37% |
168 bps |
|
|
Disclosures: The information contained within this update represents the opinion of Riverwater Partners and should not be construed as personalized or individualized investment advice. Reader should not assume that investments in the securities identified were or will be profitable. Timing differences of purchases and sales may have a modest impact on the actual contribution numbers presented. The holdings identified do not represent all the securities purchased, sold, or recommended. The calculation’s methodology along with details on all holding’s contribution to the overall account’s performance during the measurement period are available upon request. Past performance does not guarantee future results. |
Editor’s Note: The summary bullets for this article were chosen by Seeking Alpha editors.