Fundamental
Overview
This week the growth fears
came back as the we got a couple of soft US data. Most of the weakness can be
attributed to the ISM Manufacturing PMI which disappointed as it missed
expectations, and the new orders index dropped further into contraction.
Overall, the report was
much better than the prior month, but it looks like the market wanted to err on
the defensive side heading into the NFP report. We also got the US Job Openings data on Wednesday, but it was
July’s data which was bad for many other indicators as it looks like short term
factors negatively affected the data.
We are going into the NFP release
with basically a 50/50 chance of either a 25 bps or 50 bps cut at the upcoming
meeting, so the data will decide by how much the Fed is going to cut.
In today’s context though, the
prospect of a 50 bps cut amid weaker labour market data might not be enough to
lift the stock market and could actually lead to more downside on recessionary
fears, so that’s something to keep in mind.
Russell 2000
Technical Analysis – Daily Timeframe
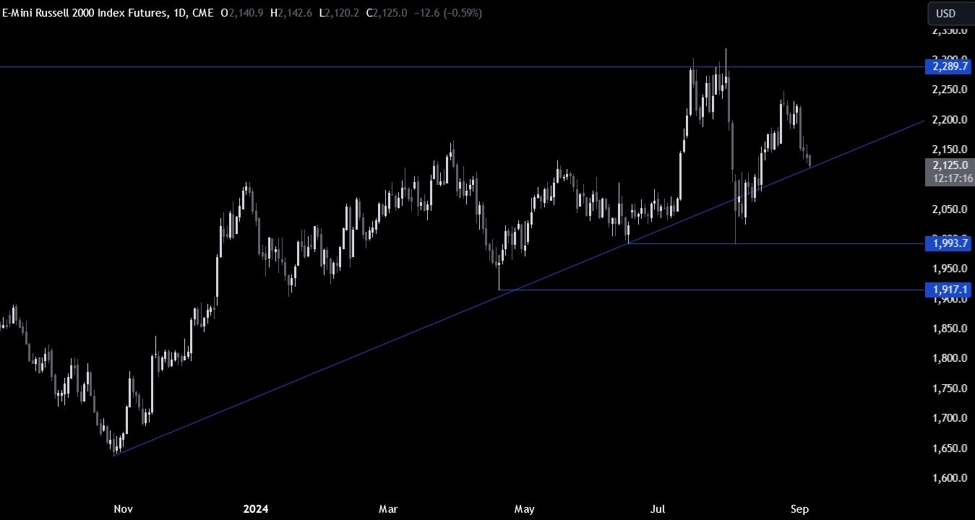
Russell 2000 Daily
On the daily chart, we can
see that the Russell 2000 is now testing the major trendline.
This is where we can expect the buyers to step in with a defined risk below the
trendline to position for a rally into a new cycle high. The sellers, on the
other hand, will want to see the price breaking lower to increase the bearish
bets into the 1993 level next.
Russell 2000 Technical
Analysis – 4 hour Timeframe
Russell 2000 4 hour
On the 4 hour chart, we can
see that we have a strong support zone around the 2120 level where we can find
the confluence of the 50% Fibonacci retracement, trendline and the previous resistance
now turned support.
This is where the buyers
will likely pile in with a defined risk below the support to position for a
rally into a new cycle high. The sellers, on the other hand, will look for a
break lower to increase the bearish bets into the 1993 level.
Russell 2000 Technical
Analysis – 1 hour Timeframe
Russell 2000 1 hour
On the 1 hour chart, we can
see that after the push lower on the ISM Manufacturing PMI, the bearish
momentum started to wane as the price action became mostly rangebound. We have
formed what looks like a falling
wedge right around the support zone.
This is generally a
reversal pattern, but a failed pattern can also be meaningful, so watch carefully
what happens after the NFP release today. The red lines define the average daily range for today.
Upcoming
Catalysts
Today we conclude the week with the US NFP report where the consensus sees
160K jobs added and a 4.2% unemployment rate.