Pgiam/iStock via Getty Images
Investment summary
Following my last report on Schneider Electric (OTCPK:SBGSF) (OTCPK:SBGSY), titled “Dividends well-supported by economic performance”, I have been pleased to see a 51% change in the company’s market valuation. In the prior report, on conservative figures, I judged that a 24% price-value gap to the upside existed, backed by SBGSF’s excellent fundamentals. So the surplus return has been great.
There have been multiple updates to the investment debate since that report, including 1) recent earnings and 2) additional profit drivers, as I’ll discuss here today.
Figure 1. SBGSF price evolution
Tradingview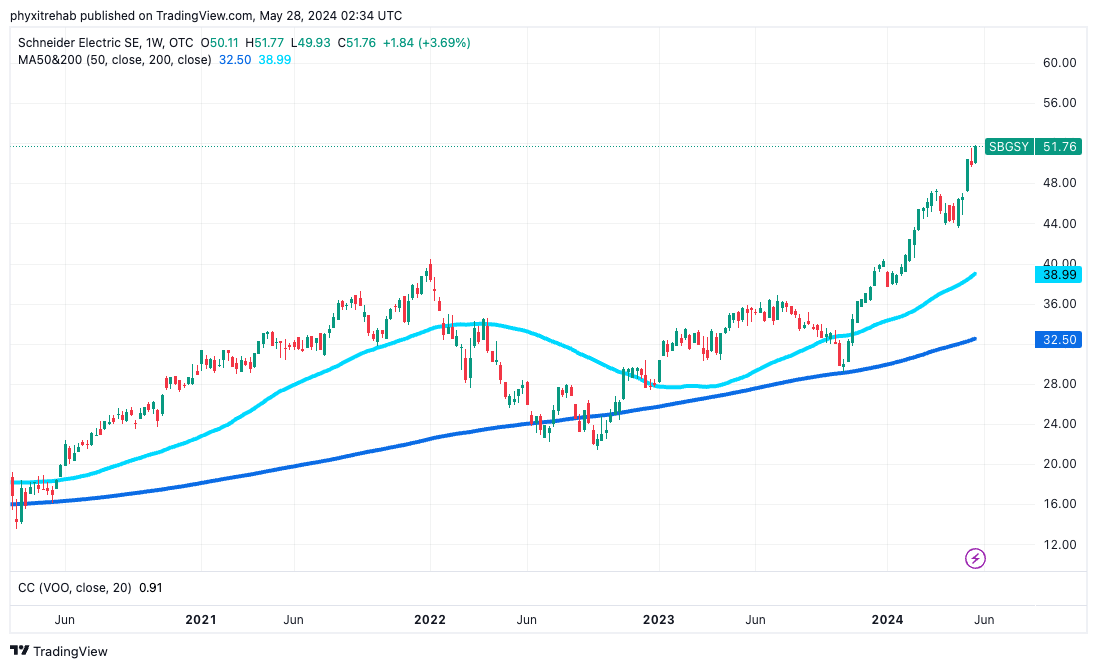
I won’t ramble on too much here – but it’s important to know what SBGSF does, its industry outlook, and a comparison to peers.
SBGSF is in the energy management business and has headquarters in France. It has an enormous global footprint across EMEA, APAC, and the Americas. The company’s end markets are 1) energy management and 2) industrial automation, for which management expects strong demand thanks to “structural megatrends” as per the first quarter investor presentation.
The company was founded in 1836 and now has 166,322 global employees. This brings total revenue per employee to a figure of $238,302 based on training 12 months revenues of $39.6 billion. (note: I will move interchangeably between USD and EUR, and will specify Euros before each occasion.)
In 2014, the company did $30.2 billion in revenues on operating income of $2.3 billion. Last year (2023), it clipped $39.6 billion in top-line sales, on operating income of $6.5 billion, and earnings of $4.4 billion. Earnings have grown From $2.1 billion back in 2014, to $2.7 billion in 2018, up to the $4.4 billion 2023 result.
Given the company’s maturity, growth is not a stand-out feature of the debate here. What, though, is SBGSF’s higher-than-average gross profit and operating margins. The company has more than double the industry gross margins of 41.8%, and a similar gap in operating margin of 16.5% versus 5.9% for the industry (Figure 2). This implies it has consumer advantages that allow it to price its offerings above industry averages, collecting this at the operating margin. This is due to its differentiated offering in energy management, which continues to be a high-growth avenue.
It may also suggest that management does a good job of keeping operating costs lower as a percentage of sales compared to peers. This margin disconnect is a competitive advantage that SBGSF enjoys in my opinion. I also talked about this at length in the previous analysis.
Figure 2.
Source: Bloomberg Finance LP, BIG Investments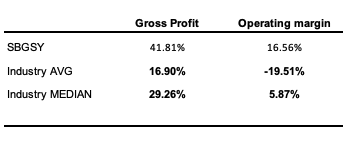
Based on an analysis of the facts, I have updated my modelling and views on the company, and believe it could attract a valuation of $267 per share. Net-net, reiterate buy.
Q1 2024 insights
SBGSF had another impressive quarter, with growth in energy management sales as the major lever. The company put up €8.6 billion in quarterly revenues, 530 basis points growth on the prior year. Around €7 billion (9%) of this gross was attributable to energy management. The industrial automation segment meanwhile contracted 660 basis points year-on-year and put up €1.7 billion.
Management retained 2024 guidance and called for revenue growth of 6-8%, getting you to around $41.1 billion at the lower end. It projects adjusted EBITDA growth of 8-12% on this, and this could contribute to around 40 basis points to 60 basis points of additional pre-tax margin, getting you to a pre-tax margin of 18% to 18.2%. Critically, both my estimates and Wall Street consensus, project similar views on this, as I will discuss. This is therefore a reasonable 2024 projection in my opinion.
Figure 3.
Schneider Electric Q1 2024 Investor Presentation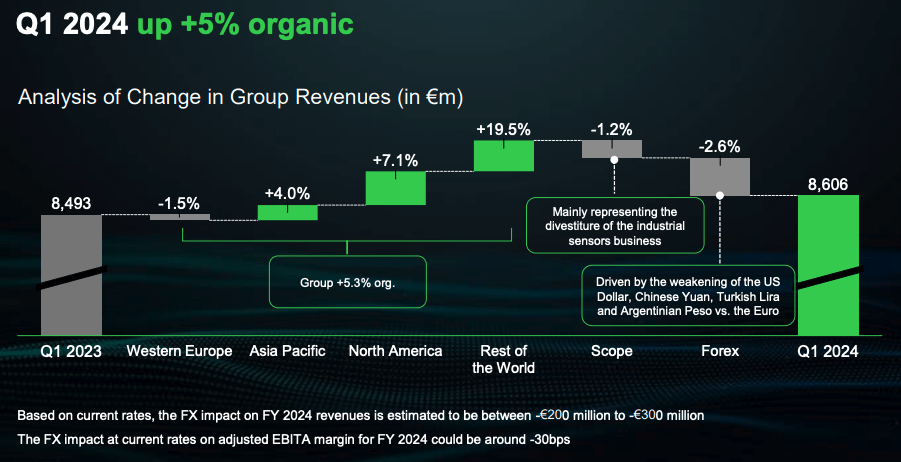
The following were highlights in terms of segment mix:
- Products were up 200 basis points year-on-year. Product sales across all divisions comprised 53% of the top line. This was driven by both price and volume (demand).
- Systems contributed 28% of first-quarter revenues, but we’re up 14% year-on-year. Management identified that demand from 1) data centres and 2) infrastructure markets are tailwinds for the segment. Meanwhile, for its industrial automation markets, demand for discrete automation is a key tailwind to consider, per the earnings call.
- Finally, software and services were up 5% year-on-year and contributed 19% of revenues for the quarter. Critically, the AVEVA acquisition continues to be a top-line lever in this segment. AVEVA’s annual recurring revenues were up 13% on the prior year, and, with RIB software and ETAP included, the segment put up roughly €1.9 billion of consolidated revenue at the end of 2023.
Figure 4.
Schneider Electric Q1 2024 Investor Presentation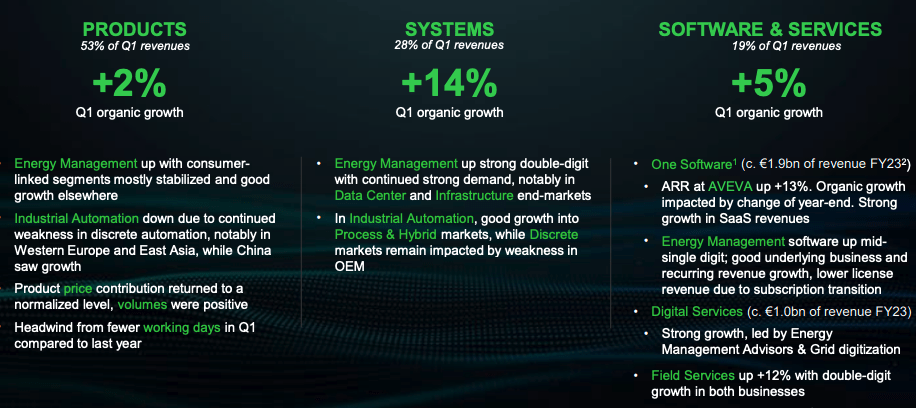
A strong takeout from the quarter in my opinion is that “rest of world” revenue – that is, excluding North America, Western Europe, and APAC – was up 23% year-on-year. Growth was particularly strong in the Middle East, per management. We are currently looking to build exposure to revenues, or with high revenue growth outside of North America, given its fiscal situation. We believe that rates could come down earlier in some emerging economies, and that this could prove to be a structural tailwind for companies with revenue exposure to these domains. As such, this is a positive for our view on the company.
Bullish drivers to market value going forward
1. Fundamental economics
Several catalysts exist in my opinion that suggest SBGSF can continue its growth in corporate valuation going forward.
For one, the return management has produced on capital invested in the business has increased substantially from 2021 on a 12-month basis.
As seen in Figure 5, returns continued to increase after its Q1 2024 results. In Q3 2021, management produced a 10.4% return on $4.3 billion of capital, and in the 12 months to Q1 2024, it produced a 13.1% return on $40.9 billion of capital put to work in the business.
The nearly 300 basis points increase is due to an increase in capital turnover, lifting from 0.8x in 2021, up to ~1x in the last 12 months. This implies that SBGSF requires less incremental investment to produce the same revenue dollars, in other words, it can produce a higher amount of revenues per$1.00 of investment in the business.
Figure 5.
Company filings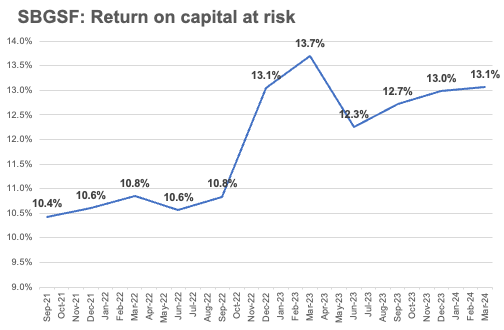
This is tremendously constructive in my view, and supports the recent increase in market value for the company. This is best exemplified in Figure 6, which shows, in dollar amounts, the incremental investment versus incremental profit growth. As observed, the two have tracked each other with striking similarity, indicating that management can produce profit growth with its capital allocation decisions. This serves as a robust litmus test moving forward – observing the change in net operating profit after tax against the capital allocation decisions of management.
Figure 6.
Company filings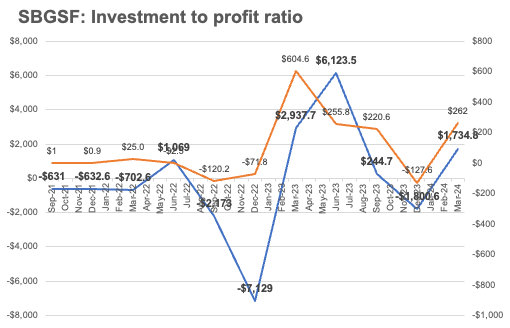
The result of such excellent business economics is observed in Figure 7. This is a company that is producing more than $3 billion in average free cash flow on a rolling 12-month basis. In periods where capital investment has been light, the company has thrown off 5 to $6 billion in cash to shareholders. Including all buybacks, this amounts to a trailing cash flow yield of 2.5% as I write. Whilst the yield may seem compressed, I can’t argue that such tremendous amounts of free cash flow are attractive for a company in this industry
Figure 7.
Company filings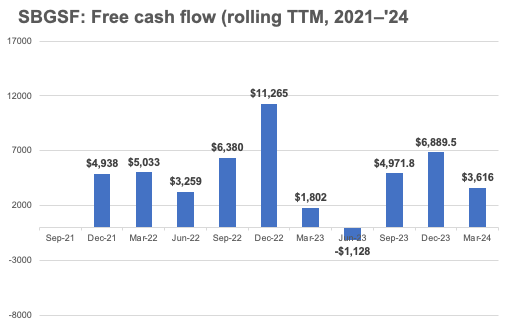
Projections at steady state of operations
Figure 8 shows how management has grown the business in terms of capital allocation and sales on a rolling 12-month period since 2021. Unsurprisingly growth has been flat at around 200 basis points a quarter, however, pre-tax margins have been strong and lifted to 17.3% over this period.
To produce $1.00 of new revenue, management has invested $0.41 to net working capital, and $0.037 of that dollar to fixed capital. Critically, its investment in acquisitions and intangible assets has wound down substantially. Management has produced sales growth by reducing intangible assets by around $0.36 on the dollar. Collectively, growth has required around $0.09 of net incremental capital, all lines included, to produce $1.00 in new revenues.
Figure 8.
Company filings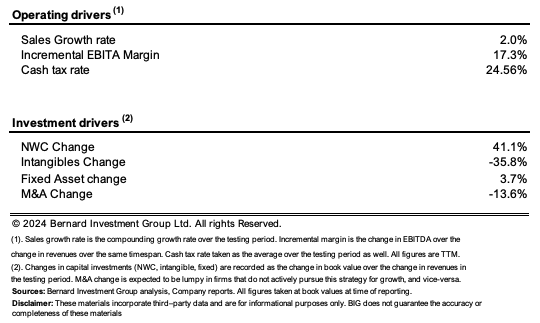
The distribution of outcomes, if SBGSF continues at this steady state of operations, is shown in Figure 9. Critically, my estimates suggest it could do $5.7 billion in tax earnings and $6 billion in free cash flow by 2025, from a 14% return on capital. This could see the firm compound its valuation at 2% per quarter.
Figure 9.
BIG Estimates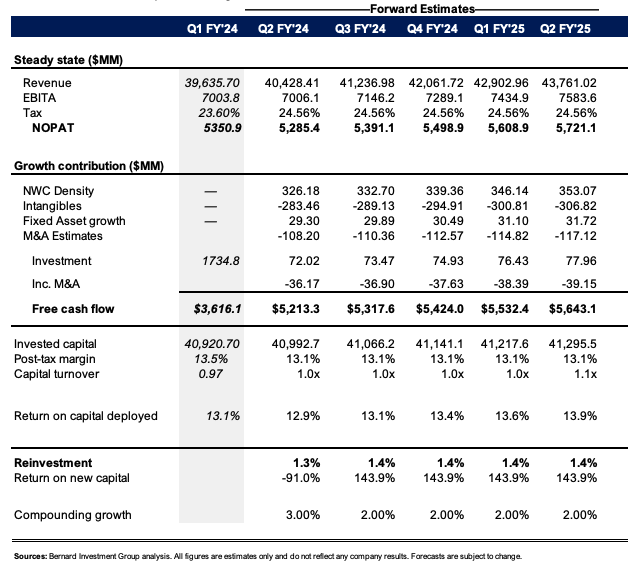
There are two factors to consider here, however.
The first is that each of the management, consensus, and myself project a higher operating margin for the company in 2024. As seen in Figure 10, consensus expects 8.4% pretax income growth this year, calling for $7.6 billion, implying a pretax margin of 18%. This is around 30 basis points on last year – and if you remember from earlier management expects a potential 40 to 60 basis points lift off this year.
Figure 10.
Source: Bloomberg Finance LP, BIG Estimates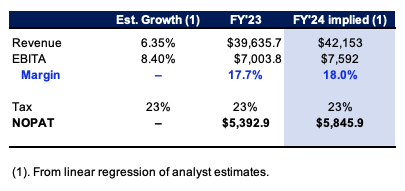
That, and strong consensus revenue growth projections of 6 to 7% over the next three years, would completely change the picture. The outcomes of when I use these inputs in my projections are seen below. Here, I assume a 4% compounding revenue growth rate, on 18% pre-tax margins with the same incremental investment requirements. It is not unreasonable to project $5.8 billion to $6 billion $ in post-tax earnings in this scenario, with the company throwing off $6.4 billion in free cash flow via 2025, expanding business returns up to 15%, in line with the current trend.
Figure 11.
BIG Estimates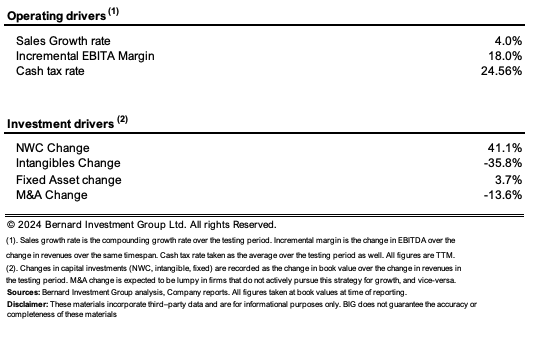
Figure 11.a
BIG Estimates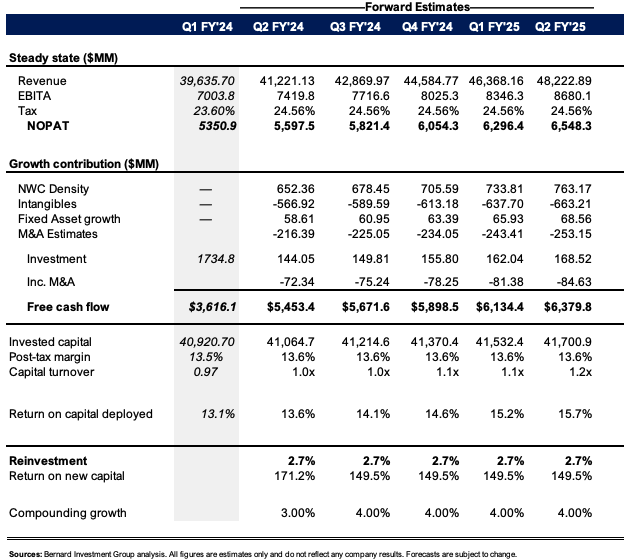
The question is, what does management need to do or invest to 1) hit the growth target, but also 2) maintain the ROIC target?
We can decipher this through the following equation (Reinvestment = growth/ROIC). My estimates suggest that to hit a 13.5% return on invested capital and grow pretax earnings by 8.4% in 2024, it would need to reinvest around $3.6 billion to achieve this amount, otherwise 62% of after-tax profits. Comparatively, it did a $1.7 billion investment last year but has put up to $6 billion of incremental invested capital in the 12 months to June 2023. Therefore, I don’t believe it is out of the realm of possibility.
Figure 12
BIG Estimates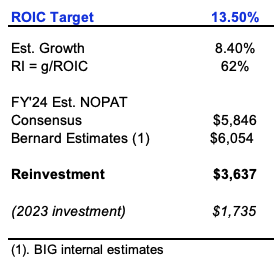
Factors affecting corporate valuation
The company sells at an extensive premium to the sector, commanding 33x trailing earnings, 22x trailing EBIT and 4.9x book value. First, I’ll compare the company’s price relative to assets employed in the business. As seen below, The company produced a trailing return on equity of 15.1%, but this reduces to 6.8% stripping out the leverage effect.
I’m not obtuse with this, – especially given SBGSF’s size, this kind of does require some amount of leverage. If paying the 4.9x multiple, however, the investor return reduces to 3% in the next 12 months, and just 1.4% without the leverage. Similarly, at the EV/IC multiple of 3.8 times, the investor return and capital would clamp to 3.4%.
In that vein, my recommendations are to consider this name over a long period. This is true given the price/value equation is currently skewed to the downside over a short investment horizon (0-12 months), due to the high multiples, but is supported over a long time frame (3+ years) due to the fundamental economics.
Figure 13.
BIG Investments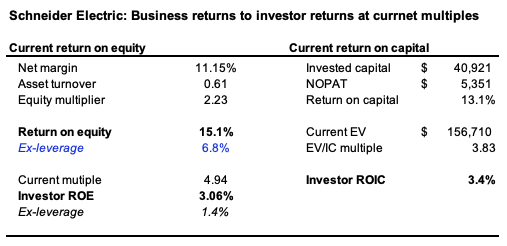
I demonstrate this in the two exhibits below. The first projects my net operating profit after tax earnings out over the coming years, although at the steady state of operations. All earnings above a 6% threshold margin are considered economically valuable here. The 6% represents starting yields on investment-grade corporate bonds in most developed markets, and therefore the passive return on money. I then discount these economic earnings at a 12% hurdle rate to the present.
Here, my estimates have the company valued at $226 per share, slight downside from where it trades today.
Figure 14.
BIG Estimates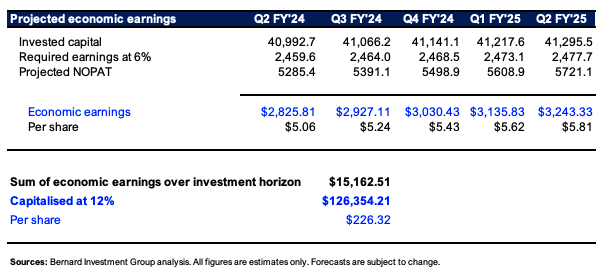
However, if the company were to hit the revenue growth targets, and see the margin decompresses up to 18%, my judgement is the company is worth $267 per share today, about fair value. In that, my opinion is, you are buying “quality at a fair price” in this name.
Figure 15.
BIG Estimates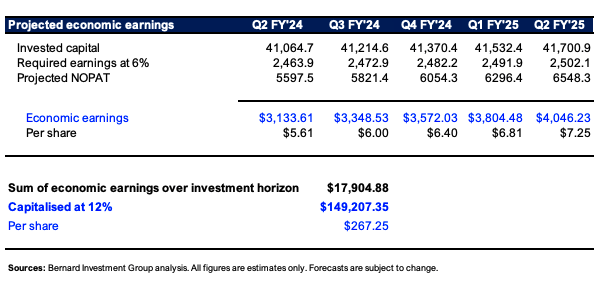
Nonetheless, given the multiples are exquisitely high, I wanted to check how this might play out in various scenarios (Figure 16). If the company does hit its growth numbers, and if the EV/EBIT multiple does not change, the company is worth $169.8 billion to us today (it currently trades at $144.6 billion).
If the multiple were to contract down to the sector average of 18x, and SBGSF hit its growth targets, The company is worth $136.6 billion to us today. If it misses earnings, and investors still pay the 22X multiple, then it still results in an implied valuation of $152 billion. In that vein, the valuation is more sensitive to multiple contraction.
If it were to contract down to the sector average, I would not be concerned though, as this would improve my average purchase price (I would load up as much as possible with such a sharp decline). Similarly, the change in earnings growth has less of an effect on the valuation than the multiple contraction. I would say this is a potential downside risk in the short term, one that investors should consider.
Figure 16.
BIG Estimates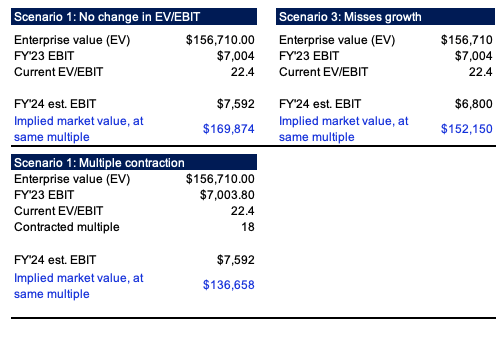
In short
In summary, I continue to remain constructive on SBGSF over the coming 3 to 5 years. Its differentiated offering within the electrical components and equipment industry continues to be positive, where it enjoys a competitive advantage through higher-than-average gross and operating profit margins.
With an extensive reinvestment runway ahead, management has demonstrated it can put capital to work effectively and to an advantage in the business. My estimates imply the company could be worth $267 per share, roughly in line with what we pay today. If multiples do contract, however, I do believe this could be a short-term negative. That is why I am recommending 1) maintaining a long-term view, and 2) adopting the notion of paying a fair price for an extremely high-quality company that looks to 3) compound its intrinsic valuation for many years to come. Reiterate buy.
Editor’s Note: This article discusses one or more securities that do not trade on a major U.S. exchange. Please be aware of the risks associated with these stocks.