Solana (SOL) is one of the strongest assets in the crypto market, currently navigating a consolidation phase following three weeks of aggressive volatility marked by significant ups and even more significant downs.
Despite the recent turbulence, Solana’s resilience has kept it on the radar of both analysts and investors, who are closely monitoring its price action.
As this period of consolidation unfolds, there is growing speculation about the potential for massive gains ahead. Some market experts are already predicting that Solana could surge toward its all-time high of $260 later this year, driven by its robust ecosystem and continued adoption.
SOL Technical Analysis
Top analyst and investor Jelle on X has recently shared a technical analysis chart that highlights a mid-cycle consolidation phase above the $130 mark. Jelle compares this phase to the consolidation period in 2021, which preceded an aggressive move up that took its price to new heights.
The chart suggests that this current phase could similarly lead to significant gains, with the analyst setting a target of $260—Solana’s previous all-time high.
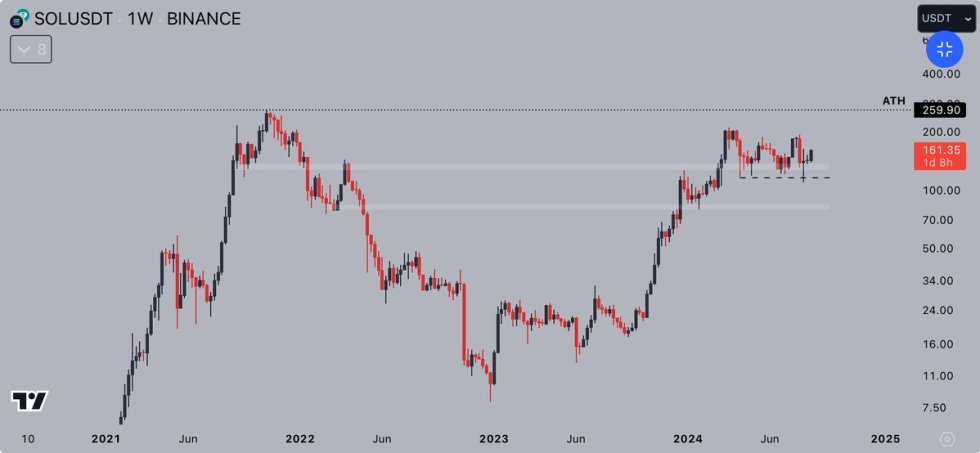
Jelle’s analysis indicates that a test of this $260 level is likely, particularly if the price can break past the $209 yearly high. This level represents a key resistance point, and clearing it could signal the beginning of a new bullish trend.
As Solana continues to consolidate, the price action in the coming days will be crucial in determining whether the asset can gain the momentum needed to push toward new highs. Investors and traders are closely watching these developments, anticipating a potential breakout that could drive the price back to its peak levels.
Price Action And Key Levels
Solana is currently trading at $158, positioned above its daily 200 moving average, which is situated at $151.33. This comes after a significant market-wide surge on Friday, driving the price up by more than 10% in just two days. Now, the asset is at a crucial point as it tests local supply levels.
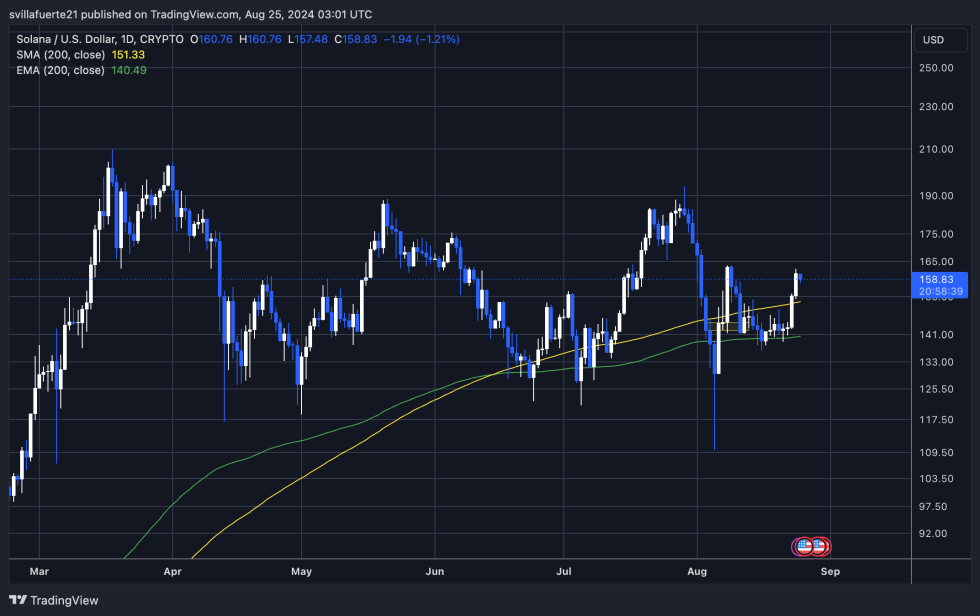
For the price to continue its upward momentum, it must break past the $163.62 mark, the local high established on August 8. Consolidating above this level would signal strength and could lead to further gains, potentially setting the stage for a move toward new highs.
However, if it fails to break through this resistance, a period of sideways consolidation below $163.62 is expected. This would mean that Solana might remain range-bound, trading within a narrow band as it waits for a new catalyst to push the price higher or lower. The price action in the coming days will be critical in determining whether it can maintain its bullish trend or if a more extended consolidation phase is in store.
Cover image from Unsplash, chart from TradingView