Solana (SOL) price prediction: Bullish vs. bearish scenarios for the future value of SOL
The Solana (SOL) cryptocurrency has been one of the most talked-about assets in the crypto space, known for its high-performance blockchain and a surge in market value in recent years.
As someone who has actively traded Solana since its early days, I’ve observed firsthand how quickly market sentiment can shift in the crypto space. I recall the dramatic rise of SOL in 2021, when it surged from under $1 to over $200 within a year, driven by widespread adoption of its high-performance blockchain for decentralized applications. Even this year, when SOL crossed up a 66 day long high of a key price level of apx $127, it then flw up another %67 in only 17 days. This experience has shown me that understanding key resistance and support levels, such as those outlined in this analysis, is crucial for navigating the volatility inherent in the crypto market.
Current price analysis 📊 with 2 sides of the coin
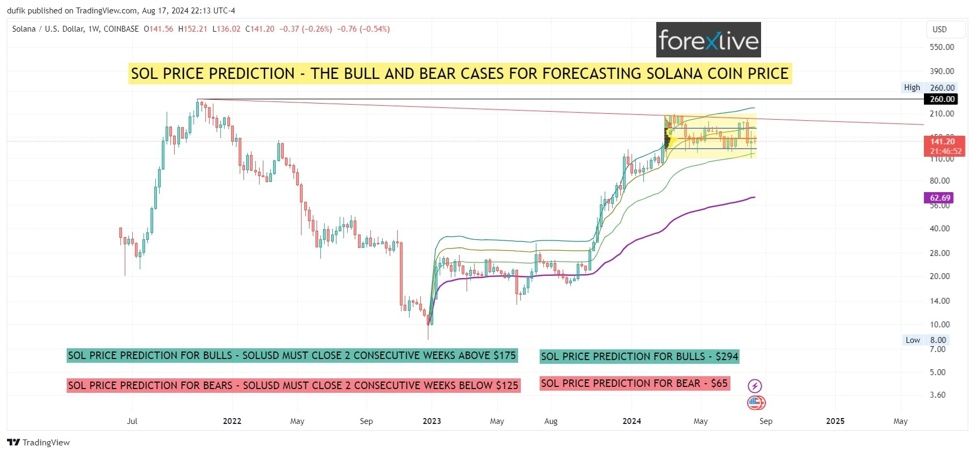
As of the latest data on the chart, Solana (SOL) is trading around the $141 mark. The chart highlights a period of consolidation, where SOL has been trading within a relatively narrow range, indicating that the market is at a critical juncture. The price has found resistance around the $175 level and support near the $125 level.
Crypto SOL Price Prediction: Bullish vs. Bearish, weeekly
Bullish scenario: A path to a new all time high 🚀… But wait for this condition…
For the bulls to take control and push SOL’s price higher, the chart indicates a key resistance level at $175. According to the analysis, a sustained break above $175 is recommended to be confirmed by two consecutive weekly candle closes above this level. This could trigger a bullish breakout, leading to a potential surge in price.
- Key Level for Bulls: $175 🟢
Significance: Closing above this level for two consecutive weeks could lead to a major bullish trend.
Next Target: $294 💰
If SOL reaches $294, it would represent a potential upside of more than 100% from the current price, making it an attractive target for long-term investors and traders. The $294 target is likely based on previous highs and Fibonacci extensions, suggesting that once the $175 resistance is broken, momentum could carry the price to new highs.
In a recent post on X, Solana Labs co-founder Anatoly Yakovenko pointed out that, for many users, the fees associated with using the Ethereum network are higher than the cost of operating a Solana node. This comparison underscores the growing debate over network efficiency and cost-effectiveness between leading blockchain platforms, which helps the bullish case.
But, in any case, in terms of price action for SOLUSD, to further understand the significance of the $175 resistance level, it’s important to delve into the use of anchored VWAP bands which offers a nuanced perspective by combining volume and price over a specific period, helping traders pinpoint areas where institutional players might have entered or exited positions. I show a thorough yet simple technical analysis of this in my following video
SOL Price Prediction video
Bearish Scenario: Downside risks and support levels ⚠️
On the flip side, the bearish scenario comes into play if Solana fails to maintain its current support levels. The chart identifies $125 as a crucial support level. For bears, a significant signal would be two consecutive weekly candle closes below $125, which could indicate the start of a downtrend.
- Key Level for Bears: $125 🔴
Significance: Closing below this level for two consecutive weeks could trigger a bearish trend.
Next Support: $65 📉
In this bearish case, the chart points to $65 as the next major support level. This level is approximately 50% lower than the current price, indicating substantial downside risk if the bearish scenario materializes.
Understanding the Technical Indicators: Standard Deviation Bands 📐
The chart features several lines of standard deviation bands based on the anchored VWAP (Volume-Weighted Average Price) from the all-time low of SOL/USD. These are not traditional moving averages but rather statistical bands that show how far the price has deviated from the mean price since the all-time low.
- Why Use Anchored VWAP Bands?
For Algorithms: Anchored VWAP and its deviation bands are commonly used by algorithms and quantitative traders to identify overbought or oversold conditions.
For Traders: These bands help traders determine potential reversal points or areas of strong support and resistance based on historical price action.
The anchored VWAP and its standard deviation bands offer a more dynamic view of the market, adjusting with price movements to give a real-time sense of market sentiment. When SOL’s price moves near or crosses these bands, it can signal potential buying or selling opportunities.
Conclusion: A critical juncture for solana ⚡ but remember these levels for guidance
In conclusion, Solana’s price is currently in an appoximate middle of a range, with key levels at $175 and $125 serving as crucial indicators of the next major move.
For Bulls: Look for two consecutive weekly candle closes above $175 to signal a potential surge towards $294. 📈
For Bears: Watch for two consecutive weekly candle closes below $125 as a potential signal for a drop to $65. 📉
Investors and traders should closely monitor these levels and be prepared for increased volatility as SOL approaches these critical junctures. The use of anchored VWAP and its standard deviation bands offers additional guidance, providing a robust framework for decision-making in a highly dynamic market.
THIS IS NOT FINANCIAL ADVICE and only my expert opinion. As always, it’s important to conduct thorough research and consider all factors, including broader market conditions, before making any investment decisions. Visit us at ForexLive.com for additional views 🧐